Hey there folks,
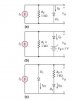
I have a little problem with graphs. The cut-in voltage is 0.7V for the diode and am required to plot output voltage and diode current versus I1 over the range 0=<I1=<2mA. The circuits are in the attached file. My attempt is, I know very clearly that output voltage is I1 for the first circuit and diode current is zero and this condition remains true for I1<=0.7 but after that output voltage is 0.7 and diode current is I1-0.7 mA.
For the second circuit, output voltage is I1 and diode current is zero and this condition remains true for I1<=1.7 but after that output voltage is 0.7 and diode current is I1-1.7 mA.
For the third circuit, output voltage is 0.7V, the current for the first diode is I1 and second diode current is zero and this condition remains true for I1<=2mA but after that output voltage is 0.7 and diode current is I1-0.7 mA.
The concept is very clear but when it comes to plotting, am lost totally, please cn someone give a clear idea about plotting it since this is very urgent and I need to know it by today!
Thanks