Continue to Site

Welcome to our site!

Electro Tech is an online community (with over 170,000 members) who enjoy talking about and building electronic circuits, projects and gadgets. To participate you need to register. Registration is free. Click here to register now.

  • Welcome to our site! Electro Tech is an online community (with over 170,000 members) who enjoy talking about and building electronic circuits, projects and gadgets. To participate you need to register. Registration is free. Click here to register now.

Harmonics

Status
Not open for further replies.

linguist

New Member
I have been reading up on signals & harmonics etc & came across an old post by Audioguru that had an explanation & a simulation of a 2N3904 circuit that produced
2nd harmonic distortion.

Here's the link:
https://www.electro-tech-online.com/threads/old-distortion-analyzer-and-audio-analzyer.19571/

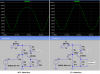
In the attachments below, one is of the circuits that audioguru posted with harmonic distortion with the 2N3904 circuits.

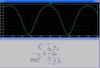
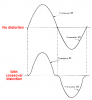
I don't really understand, if the simulation is of the fundamental frequency & a 2nd harmonic the waveform would look more like the second attachment I have posted that shows a fundamental waveform combined with a 2nd harmonic signal at twice the fundamental frequency.

In audioguru's attachment it looks like the signal is just compressed on the top peaks rather than having a 2nd harmonic in the output signal?

Maybe I am reading it all wrong or my understanding so far is not up to scratch?

Could someone help me out with this please.

Cheers
 

Attachments

  • 2nd Harmonc Distortion.png
    2nd Harmonc Distortion.png
    34.6 KB · Views: 198
  • Sim.gif
    Sim.gif
    11.4 KB · Views: 268
The difference between the waveforms is the phase of the second harmonic. The first waveform that Eric posted shows typical 2nd harmonic distortion, where one peak is much sharper than the other. Your simulation may have the same harmonic content as Eric's, but on yours the peaks of the second harmonic are at a different time.

I haven't analysed your waveform and Eric's, but I also suspect that yours may have a higher amplitude of 2nd harmonic.

There may be no audible difference between waveforms that have the same levels of harmonic distortion, but different phases. However there is a big difference between what they look like on an oscilloscope.
 
Diver300 thanks for the reply,

Yes I can see what your saying, the amplitude of the second harmonic is at a greater amplitude than audioguru's simulation.

Now you have mentioned about the phase, suddenly it all makes it a lot easier to understand.

Thanks for the explanation, very grateful!

Cheers
 
Hello there,

If you have any doubt, you can always simulate the second harmonic only phase shifted by adding a phase shift to the 2nd harmonic wave and do the same simulation. You can vary the phase shift and then observe the waveform and then vary the phase shift a little more and observe the waveform again. If you do that in increments of say 22.5 degrees you should be able to see a variety of waveforms all with 2nd harmonic content that all look a little different than the others.
 
Even harmonic distortion is usually more tolerable than odd harmonic distortion for music, since even harmonics just add a small signal in multiples of an octave above the fundamental, which generally just makes the music sound a little "brighter". Odd harmonics, such as generated by clipping the waveform, add a harshness to the sound.
 
Last edited:
Thanks MrAl & crutschow,

Yes I see what your saying, I will have a look at the simulation, I didn't think of that?
Thanks for the help

Cheers
 
Hello again,


Yes you can enter a value in degrees for "Phi" for the sine source. Entering "90" is 90 degrees and makes a cosine wave.
 
In the other thread I said, "If the upper half of a waveform is amplified or reduced more or less than the lower half, then there is even-harmonics distortion".
A transistor or vacuum tube without negative feedback compresses half of the waveform.
But when you add the second harmonic to the fundamental with resistors then you are doing the opposite of compression (expanding?) half the waveform which might sound the same.
 
audioguru,

I forgot to ask, could you give me an example of how to add resistors in a circuit like you mentioned above to expand the signal with a 2nd harmonic frequency.
I would like to learn more about that!
Is their technical term used for this so I can look it up as well?

Cheers
 
Hi linguist,

I see you are using LT Spice, so perhaps it will help your understanding if you can see a graphic representation of the output's spectrum of frequencies produced by distortion of the input signal by a circuit whether active or passive.

LT Spice has a Fast Fourier Transform function with a graphic display akin to an analog or hybrid spectrum analyser. When the circuit to be tested is constructed including labels for the netlist nodes of interest and a transient response done, right click on the plot displayed. A menu box will appear so select "view" at the bottom and slide the cursor over to FFT and click. A selection box will appear so then pick the labeled nodes of interest such as the input and output and then click on OK. Another box will appear and select those nodes again then click OK. The FFT plot will appear displaying the entire spectrum of frequencies of the nodes selected.

I recreated AG's first circuit you posted, and ploted the transient response along with the FFT, which can be seen below. Note that the second harmonic at 8khz is 13.5db below the fundamental as shown in the data box in the ratio portion at the bottom. Also note the third harmonic at ~24db below the fundamental, yet those same frequencies of 8kHZ and 12kHz at the input are far and away below the fundamental.

If you do AG's design as I did and reduce the input to 3mv, you can see that the overdriven design produces a second harmonic at ~32db below the fundamental. It's got a lot to do with the design and the parameters involved.

Perhaps these graphics and this comentary will help with your understanding.

Merv
 

Attachments

  • AG Amp.jpg
    AG Amp.jpg
    148.8 KB · Views: 171
  • AG Amp FFT.jpg
    AG Amp FFT.jpg
    205.8 KB · Views: 182
Thanks Merv,

Interesting stuff, I will have a look & see if I can understand it properly.

This will help a lot, Thank You!

Cheers
 
I tried the FFT function in LTspice but I am getting a totally different result than the example given.
I must be doing something wrong, I have attached the asc, could you have a look & see what I am doing wrong.


Cheers
 

Attachments

  • Simulation.asc
    1.5 KB · Views: 140
linguist,

You did nothing wrong, I just didn't explain everything...my error. When I did the plot of the FFT I had the transient start time to collect data at 9ms for 1ms of data, then to accentuate the distortion of the transient plot I changed it to 9.4ms. Just change the transient data start time to 9ms. Also note that I changed the spectrum width (horz. axis) of the FFT to 1khz to 1MHz for greater resolution of the frequency peaks. Just for giggles, try changing the data start time to 6ms and see how much more information is in the plot...too much with much less verticle resolution to determine the peaks.

Sorry for the confusion,
Merv
 
I got it work but I am not sure how you get the second Cursor reading, I can get Cursor 1 reading but not sure how to get the second cursor reading like in your example?
I have attached a picture, you will see only one cursor reading.

When looking at the FFT on screen & the frequency spectrum of the output, what are we actually looking at in regards to say 10% -20% etc 2nd Harmonic distortion.

Example:
The Fundamental frequency on the attachment is around 7.7dB, how many dB does the second harmonic have to be to be audible with a definite difference in sound.

Just trying to understand what does & what doesn't make an audible difference.

Cheers
 

Attachments

  • FFT.gif
    FFT.gif
    28.2 KB · Views: 171
Total harmonic distortion is when all the harmonics produced by distortion are added and noise is also added.
Most people can hear total harmonic distortion of 1% (-40db).
Some people can hear total harmonic distortion of 0.1% (-60db).
Few people can hear total harmonic distortion of 0.05% (-66dB).

A good opamp like an OPA134 has total harmonic distortion of 0.00008% when its gain is 1 or total harmonic distortion of 0.008% when its gain is 100 for a microphone.

An LM324 and LM358 are old and are low power opamps that have crossover distortion. When their gain is 1 the crossover distortion is 0.3%. When their gain is higher then the total harmonic distortion becomes obvious and the crossover distortion is worse.

Transistor circuits with only one or two transistors have much more distortion.
 

Attachments

  • crossover distortion3.PNG
    crossover distortion3.PNG
    18 KB · Views: 547
  • LM324 crossover distortion3.PNG
    LM324 crossover distortion3.PNG
    15.2 KB · Views: 174
Thanks audioguru,

It seems it doesn't take much harmonic distortion to be audible, as you mentioned
1% (-40dB).

Could you help me with an example of how to add resistors in a circuit like you mentioned before to expand the signal with a 2nd harmonic frequency.
I would like to learn more!
Is their technical term used for this so I can look it up as well?

Thanks for the info once again.

Cheers
 
I got it work but I am not sure how you get the second Cursor reading, I can get Cursor 1 reading but not sure how to get the second cursor reading like in your example?
I have attached a picture, you will see only one cursor reading.

To do that, place the mouse cursor on the name of the trace of interest at the top of the plot, such as V(out), and when the pointer appears, right click and a box will appear. In the upper right corner, click on the blue arrow of "Attached Cursor", select "1st & 2nd" and then click on OK to close the box. Those two cursors are now link to the values of the plot trace selected. If one wants to compare the value of another to that of the initial plot trace, say V(in), place the mouse cursor on that trace name and left click once and move the traces to the points of interest. By left clicking a second time, both cursors will attach to the second trace. This will work on any plot, transient, FFT, etc.

When looking at the FFT on screen & the frequency spectrum of the output, what are we actually looking at in regards to say 10% -20% etc 2nd Harmonic distortion.

I presented this option so you might see the relationships of the harmonic distribution/content in the full spectrum given your initial inquiry. If one compares the voltage ratio of the fundamental to the total value of that in the harmonics, the TDH can be determined. For further background info. check out this link:
Total harmonic distortion - Wikipedia, the free encyclopedia

To get the actual THD from LT Spice modeling, you can use this basic spice directive I'll describe:

With the schematic selected, click on the ".op" icon in the very upper right of the toolbar. When the box opens and with the "spice directive" button selected (above the dialog area) type in .four 4k V(out) . This instructs LT Spice to compute the fourier component of the fundamental frequency of 4kHz (the frequency in this particular case) of V(out) with the default value of nine points, the fundamental and eight harmonics. Look up "harmonics" in the help section to customize the spice directive for a number of options.

To see the result, run a transient response, and when the plot is displayed, follow the procedure to view the FFT plot, BUT select Spice Error log instead to view the values of the fundamental, the individual harmonics and the THD.

Example:
The Fundamental frequency on the attachment is around 7.7dB, how many dB does the second harmonic have to be to be audible with a definite difference in sound.

Just trying to understand what does & what doesn't make an audible difference.

I would think that a composite 30db or greater below the fundamental would be more than acceptable. That's a ratio of 1000:1.

Sorry, but I can't be of too much help beyond there. I haven't heard anything very well after a couple deployments to Southeast Asia forty odd years ago. Perhaps AG or another can help you with that comparison.

Hope the above give you some additional information.

Regards,
Merv
 
Status
Not open for further replies.

Latest threads

Back
Top