Continue to Site

Welcome to our site!

Electro Tech is an online community (with over 170,000 members) who enjoy talking about and building electronic circuits, projects and gadgets. To participate you need to register. Registration is free. Click here to register now.

  • Welcome to our site! Electro Tech is an online community (with over 170,000 members) who enjoy talking about and building electronic circuits, projects and gadgets. To participate you need to register. Registration is free. Click here to register now.

Question about Pode Plotter reading interpretation?

Status
Not open for further replies.

samy555

Member
hello

When the plotter read voltage gain = +3.979 dB @ 100MHz for the L-impedance matching circuit shown

**broken link removed**

How much power from the source is on the R2 (the load resistance)?
thanks
 
hi sam.

This LTSpice simulation shows your values are very close.

Is this what you are asking for.??

E.
 

Attachments

  • AAesp01.gif
    AAesp01.gif
    37.7 KB · Views: 155
  • AAesp02.gif
    AAesp02.gif
    37.6 KB · Views: 158
Alternate way of asking LTSpice the question. Green trace is power input to the network vs freq. Red trace is power in R2 vs frequency.

Note that Pin peaks at ~110MHz, while Po peaks at 100MHz.
 

Attachments

  • DF67.jpg
    DF67.jpg
    131 KB · Views: 178
How to convert voltage gain to power gain?

Hello
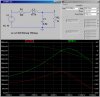
I simulate this circuit using multisim 10
**broken link removed**
The Result on the pode plotter was:
20*log (V_load/V_source) = 3.979 dB @ 100MHz
How can calculate (or measure) 10*log (P_load/P_source)?
thanks
 
No, I asked the question in the wrong way, and placed the wrong image.
I repeated my question

I want to know how to get (in a quick way) the power gain voltage gain resutled by pode plotter

thanks alot
 
Last edited by a moderator:
Status
Not open for further replies.

New Articles From Microcontroller Tips

Back
Top