Continue to Site

Welcome to our site!

Electro Tech is an online community (with over 170,000 members) who enjoy talking about and building electronic circuits, projects and gadgets. To participate you need to register. Registration is free. Click here to register now.

  • Welcome to our site! Electro Tech is an online community (with over 170,000 members) who enjoy talking about and building electronic circuits, projects and gadgets. To participate you need to register. Registration is free. Click here to register now.

Simulation of TDR using LTSpice

Status
Not open for further replies.

hjazz

New Member
Hi all,

I'm trying to simulate a TDR based on the figure below, and one of the scenarios is a short circuit. The simulation should last for 140ns.
15hihyh.png

The parameters are

ZA = 50 Ω
TA = 5 ns
ZB = 75 Ω
TB = 10 ns
Rise time of source signal τr = 0.1 ns

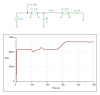
I took this website as reference to come up with the schematic below:

xcnh2v.png


As nothing about the voltage source was given other than the rise time, I didn't really know what to put as its parameters, so I took most of the parameters given in the reference website.

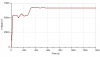
I then probed the wire between R2 and TL-A to get the graph.

First of all, is my simulation even correct? This is the first time I'm using LTSpice, and I'm completely new to this electronics topic.

Second, as I've only seen TDR with one transmission line, I'm not sure how to interpret the graph.

a) I thought this circuit is similar to 3 resistors in series - R2 (50 Ω), ZA (50 Ω) and ZB (75 Ω). So shouldn't the incident voltage at the point between R2 and TL-A be 50/(50+50+75)=0.571V?

b) I understand that the time taken for the signal to come back to the probe point is twice the transmission delay. Isn't this the case be it 1 or 2 transmission lines?

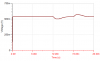
At the probe point, I thought it takes 2(5ns + 10ns) = 30ns for the reflected signal to first reach the probe point, meaning the voltage level at that point is constant until 30ns? Why is the voltage level changing at 10ns already, and for it to actually increase?

c) Why are the next voltage level changes at time intervals of 20ns? Why not at multiples of 30ns?

Thank you.
 
First, let me declare that I know very little about simulators, but I do know a bit about transmission lines.

I thought this circuit is similar to 3 resistors in series
No, transmission lines are not resistors.

shouldn't the incident voltage at the point between R2 and TL-A be 50/(50+50+75)=0.571V?
If this resistor assumption were correct (which it isn't), the expression should be more like 50 + 75/(50+50+75)=

I understand that the time taken for the signal to come back to the probe point is twice the transmission delay. Isn't this the case be it 1 or 2 transmission lines?
Basically, yes.

As the pulse travels from R2 to TLA it will see the surge impedance of TLA as 50R, ie no change in impedance, so no reflection.

As the pulse travels from TLA to TLB it will see the surge impedance of TLB as 75R. An impedance change so there will be a reflection. The impedance is higher, so the reflection voltage will be higher.
This reflection will be seen at the R2 TLA junction after 2 x 5nS = 10nS. The simulation shows this.

As the pulse travels from TLB to ZL it will see the surge impedance of ZL as 0.001R. An impedance change so there will be a reflection. The impedance is lower, so the reflection voltage will be lower.
This reflection will be seen at the R2 TLA junction after 5 + 10 +10 +5 = 30nS. The simulation shows this.

Now it starts to get tricky!

As the reflection from the load ZL passes from TLB to TLA, there is another impedance change from 75R to 50R, this creates a reflection back to the load, which then reflects back to the source. So after a trip up and down TLB ie 10 +10 = 20nS we see a further reflection at 50nS total time.
Not only that, there is another reflection as the reflection meets the TLB TLA junction again. So after another 20nS (70nS total) we see a reflection back at the R2 TLA junction.

I hope that makes a bit of sense because my head is starting to hurt, and it is lunch time!

JimB

Edit...
A bit of terminology.
I transmission lines, Surge Impedance is the same as Characteristic Impedance.
 
As the pulse travels from R2 to TLA it will see the surge impedance of TLA as 50R, ie no change in impedance, so no reflection.
Ok, so for 0-5ns, pulse is traversing through TLA (ignore TLB and ZL), and the voltage is 50/(50+50)*2 = 1V. Why is the voltage still 1V from 5-10ns if there is no reflection?

As the pulse travels from TLA to TLB it will see the surge impedance of TLB as 75R. An impedance change so there will be a reflection. The impedance is higher, so the reflection voltage will be higher.
This reflection will be seen at the R2 TLA junction after 2 x 5nS = 10nS. The simulation shows this.
Does the reflection occur right at the beginning or at the end of the transmission line? Why does it seem like the reflection from TLB is reflected immediately after hitting TLB, hence taking only the round trip time via TLA to reach the probe point, instead of 5 (through TLA) + 10 (reached end of TLB, reflect) + 10 (go back out of TLB) + 5 (go back out TLA) = 30ns to reach the probe point?

As the pulse travels from TLB to ZL it will see the surge impedance of ZL as 0.001R. An impedance change so there will be a reflection. The impedance is lower, so the reflection voltage will be lower.
In the case of a short circult (ZL = 0), the reflection coefficient is -1, right? This is at time = 30ns? Why is the voltage level 0.2V?
 
Ok, so for 0-5ns, pulse is traversing through TLA (ignore TLB and ZL), and the voltage is 50/(50+50)*2 = 1V. Why is the voltage still 1V from 5-10ns if there is no reflection?
Your source is an ideal voltage generator giving 2v (I assume) in series with a 50R resistor.
When this source is loaded with 50R (TLA) the voltage at the junction of R2/TLA will be 1v as you have calculated. Simple voltage divider maths.

Does the reflection occur right at the beginning or at the end of the transmission line?
Reflections occur at impedance discontinuities, ie where the impedance changes.
You have impedance changes at TLA/TLB and TLB/ZL.

Why does it seem like the reflection from TLB is reflected immediately after hitting TLB, hence taking only the round trip time via TLA to reach the probe point, instead of 5 (through TLA) + 10 (reached end of TLB, reflect) + 10 (go back out of TLB) + 5 (go back out TLA) = 30ns to reach the probe point?
Look at this pic, it may help:

Reflections down the line.jpg


In the case of a short circult (ZL = 0), the reflection coefficient is -1, right?
Yes.

This is at time = 30ns? Why is the voltage level 0.2V?
Because not all the energy has been reflected back yet due to the TLB/TLA impedance discontinuity. Some of the energy is still reflecting back and forth between TLB/TLA and RL, which is why there are more reflections getting smaller and smaller as time goes on.

JimB
 
I'm now working on a variant of the scenario posted in my original post, and would like to know if I'm on the right track.

Now, I'm trying to simulate the discontinuity below, with the given parameters.
335b3f8.jpg

ZA = 50Ω
TA = 5ns
TB = 7ns
C = 20pF
L = 65nH
RL = 100Ω

I have come up with the schematic and plot below.

5uoeo8.jpg


Is my schematic correct? The plot doesn't seem as "clean" as the example given here (and reproduced below), but I thought that might be due to the reflection from RL.

2gumc10.jpg


I think the wave after 2Tp in the example diagram above is what I have at t = 10ns in my simulation. Is this correct?
 
I doubt you would get as clean a signal as shown in the reference. I replicated your circuit in TINA simulator. I used 3.25 feet of RG-58/U model to get the 5 nS delay and 4.55 feet for the 7 nS delay. The step generator's internal resistance was set to 50 ohms. The step voltage was set for 1 volt.
 

Attachments

  • TDR-01.png
    TDR-01.png
    9.2 KB · Views: 409
Last edited:
I doubt you would get as clean a signal as shown in the reference. I replicated your circuit in TINA simulator. I used 3.25 feet of RG-58/U model to get the 5 nS delay and 4.55 feet for the 7 nS delay. The step generator's internal resistance was set to 50 ohms. The step voltage was set for 1 volt.
Thanks! Is there a reason why your plot transitions are gentler than mine, especially the first dip downwards?

And is the difference in voltage due to me using a 2V step voltage (so that the voltage entering the transmission line is 0.5(2) = 1V), while you're using 1V?
 
Notice I am running the simulation from 0 to 50 nS while you run out to about 140 nS. How many samples are you taking in that 140 nS?

Here is my results out to 140 nS. It's probably closer to yours. The sampling rate, in real equipment, as well as simulations, will roughen the graph. The prime example is if you ran a bode plot on a resonant circuit. Run the start frequency further away and you will see the nadir disappear at some point. Run the start and finish frequencies closer, your graph would be smoother. The same when making graphs in Excel.
 

Attachments

  • TDR-02.png
    TDR-02.png
    5.5 KB · Views: 341
  • tdr-03.png
    tdr-03.png
    5.4 KB · Views: 306
Status
Not open for further replies.

Latest threads

New Articles From Microcontroller Tips

Back
Top