Continue to Site

Welcome to our site!

Electro Tech is an online community (with over 170,000 members) who enjoy talking about and building electronic circuits, projects and gadgets. To participate you need to register. Registration is free. Click here to register now.

  • Welcome to our site! Electro Tech is an online community (with over 170,000 members) who enjoy talking about and building electronic circuits, projects and gadgets. To participate you need to register. Registration is free. Click here to register now.

sampling, filtering, PWM etc.

Status
Not open for further replies.
OK, try thinking about it this way:

We have a signal, it is a sine wave, it has one component in its frequency spectrum, if we feed that signal into an ADC what number will the ADC give us?
Who knows, it is anybodies guess because the signal is continually varying.

(As I am writing this, I think I have just realised why you are confused....)

So we have a "sample and hold" circuit, which takes the instantaneous value (the sample part) of our sinewave signal and effectively converts it to DC (the hold part).
The ADC can now convert the value into a number.

(MrAl has just posted as I am trying to find a way to express all this.)

In your picture jim5 the output of that sampling gate will look like the spectrum shown.
BUT, you are considering an ADC input which is a SAMPLE and HOLD circuit, which is effectively creating a DC value for which there is no complex spectrum.

Are we getting there yet?

JimB
 
Thank you, MrAl, JimB.

Though both of you have done your best to help me, I'm extremely sorry that I'm still confused to the same degree.

The following quotes are important where JimB himself has said that the original signal after sampling gate or switch is not the same.

The signal after the sampling gate will have some harmonic content because of the sampling process.
The original signal is not the same after the sample gate, so the spectrum of the signal will not be the same, it will contain harmonics generated by the sampling (switching) process.

After the sampling switch, we see that the output is effectively the sample gate switching signal modulated by the signal under test.
This is where the harmonics are, not in the original signal.

Please have a look on this figure again.

What does the spectrum of measured signal mean to you? In simple words, it means that if we add a DC value to two sinusoids of frequencies of 1 Hz and 2 Hz of different amplitudes, we will get the signal.

What does the spectrum of sampling signal mean to you? In simple words, it means that the signal is made up of a DC value plus a sinusoid of 6 Hz plus another sinusoid of 12 Hz and so on. (There are infinite number of sinusoids where as the frequency increases the amplitude decreases, and if we like then we could also think in terms of positive and negative frequencies).

Finally, what does the spectrum of sampled signal mean to you? It means that when all those sinusoids having the shown frequencies (and also those not shown in the figure) are added up with a certain DC value, the result would be the shape of sampled signal. Think in terms of time domain instead of frequency domain. Do you really imagine that such a sampled signal by any means will have the shape of measured signal? The measured signal only consisted of a DC value plus two sinusoids but the sampled signal is a totally different creature with lots arms and legs! If you think that what I'm saying is correct then an ADC is 'sensing' a totally different signal at regular intervals. It's like analyzing the DNA of a zebra when you were supposed to analyze the DNA of a chimp! :) Do I make it any clearer now? Please help me. Thanks.
 

Attachments

  • jim6.jpg
    jim6.jpg
    93.1 KB · Views: 578
Do I make it any clearer now?
Unfortunately, no.:(

Can I wind this thread back to the beginning?

In Post#1 Q1 you asked about filters and why a capacitor was not used on its own to create a filter. I hope you have that sorted out now.

In Post#1 Q2, what are you really asking about?
Is it the operation of an ADC?
Is it the spectrum of a sampled signal?
Or, something which MrAl and I have failed to see?

Please advise.

JimB
 
Hi PG,

Are you saying that you are trying to analyze the waveform that the ADC count represents?
For example, when the input is 2v the ADC might get a count of 200 (to keep this simple) and then it ramps up to 3v and the ADC takes another sample and it gets a count of 300, so when you look at 200 at t0 and 300 at t1 you see a stepped wave rather than a sinusoid. So a sinusoid would look like a staircase up and down then back up again etc. rather than a smooth wave as the original was. Is this what you are trying to analyze?
 
Thank you.

Is it the operation of an ADC?
Is it the spectrum of a sampled signal?

It is both. If the spectrum of sampled signal is not a bad or horrible representative of the measured signal (as I'm saying) then how can an ADC 'extract' accurate samples out of it? It would be "accurate sampled" only if they correspond to the values of measured signal. On the other hand, if the ADC is really extracting accurate samples which almost represent the measured signal then ADC should be doing something to the spectrum of sampled signal so that it gets back somewhat close replica of the measured signal from the spectrum of sampled signal.

I can only request you that please try to go thru my post related to this query again because it's look like I can't do any better than that. Thanks a lot.
 
Hi MrAl

You posted while I was writing my previous post. I can also request you to go thru post #22 again. You might see that what is confusing me. Thank you.
 
Hi,

Yes i read that that is why i asked the questions.
 
I have been thinking about this for the past two days, and I just do not know what else to say, except:

As far as the ADC is concerned, the spectrum of the sampled input signal is not relevant, there is no point in thinking about it.
There are several types of ADC, some are slow, some are very fast in their operation.
The incoming signal is sampled at some instant (a very short period of time) and the value is held in the Sample and Hold circuit for as long as the ADC needs to digitise the value of the signal.
End of story, nothing to do with spectra and impulses and sidebands, nothing, zippo, nada.

When a DAC is used to create a signal from digital data (numbers) which was either previously sampled by an ADC or generated mathematically, the output signal of the DAC has a spectrum as I have described last week. It is usual to filter the output to remove the harmonics of the sample frequency and the associated aliases.

END.

JimB
 
Hi again,

Jim:
Yes it appears that PG was looking at the spectrum of the sampled signal but he didnt answer by question regarding that where i wanted to make sure that's what he was talking about.

Jim,PG,All:
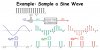
The sampled signal if looked at as an output rather than just a sequence of counts looks like a staircase signal that follows the input signal. If the input was a ramp from 0 to 5v then the output would look like a staircase from 0 to 5v where each step would be the voltage measured at each sample period. So if we took samples every 1 seconds and the wave went from 0 to 5 in 5 seconds, we'd see an output sequence (converted back to voltage) of: {0,1,2,3,4,5}.

Now i think the question PG is thinking about is how do we deal with this signal. It's not 'really' a ramp anymore, it's a sequence. The sequence represents the ramp but it's not really a continuous ramp anymore, and this might be the input to the next 'stage' which could be a filter which might be a digital filter inside the microcontroller in code.
For this we would be using a digital filter but i dont see why we could not simply output that sequence right away and then deal with it, for the sake of simplicity. In the real world however we'd use a digital filter and the digital filter would be operating within a digital framework that understands that the signal is a sampled signal already and it's output would in turn be digital.

So for simplicity say we output the signal right away instead of using a digital filter. What we see on the output is a staircase. Within the digital world however it's not a staircase, it's just a set of singular points which means that the signal is not defined anywhere else but at those distinct points. So if we had that sequence and the sample time was 1 second, then the signal is only defined at 0 seconds, 1 seconds, 2 seconds, 3 seconds, 4 seconds, and 5 seconds. It is not defined at say 2.5 seconds, or 3.1 seconds, or 1.9 seconds, or 3.0035 seconds for some examples, because it is not defined between any two samples.
When we output this signal as an ANALOG signal however, then it becomes *easier* to view each sample as a continuous DC value that extends from the start of the sample time period to the end of the time period because that's the only information we have for that entire time period. If we wanted to convert the digital representation to analog in reality what we are doing is storing the digital signal and extending it out over the entire sample period.

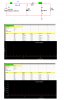
Ok, so we see a staircase on the output. That's not the right signal that we need however for analog purposes for say an audio output. There are harmonics which might be heard by the listener so we'd have to filter them out. This is where knowing the spectrum of the signal *in analog terms* comes into play. It's not that hard to understand though, because if we have a certain sample period then the highest amplitude harmonic will be the one that matches the sample clock rate.
What we have is a series of rectangular waves, where only one point at each rectangular top matches the correct signal, and we know that rectangular wave harmonics decrease as the inverse of the harmonic number, so if we use a low pass filter that can effectively reduce the highest harmonic then we know the others will not only be cut more than the lowest, the others are already lower in amplitude to begin with so we end up reducing all the higher harmonics even more than the lowest one which we would call the fundamental.

So the short answer is that when we use a low pass filter on the pseudo sampled signal (the staircase isnt really a sampled signal it's a time extended version which we end up with because our sampling process is not a true sampling process as it does this automatically, and we dont change it because it actually makes it easier to work with anyway once we get back to the analog world) and that filters out the highest amplitude signal as well as the harmonics because the harmonics always get attenuated more plus they are lower to begin with.
This is easy to show with even a simple RC low pass filter.

Also note that the sampling frequency could be chosen so that it is much higher than the highest desirable frequency so with a low pass filter the highest desirable frequency does not get affected much by the filter, only the clock signal and its harmonics get attenuated significantly.
 
Last edited:
Thank you very much, JimB, MrAl.

I really appreciate your effort to help me. I was taking some time to make sure that my confusion had some legitimate reasons and besides this I was busy with something else. So, if you don't mind, I will get back to this query in next few days.

Best wishes
PG
 
Hi JimB, MrAl:

I offer my apologies because now I look back and can't even know what was really confusing me. I was perhaps picturing it wrongly. At least, it shows that how confusing it could be if one doesn't follow a proper diagram or reference. A proper context always makes things easier to understand. Anyway, this set of diagrams is self-explanatory. Thank you.

Regards
PG
 

Attachments

  • samp_conf.jpg
    samp_conf.jpg
    116.1 KB · Views: 566
I look back and can't even know what was really confusing me.
We have all been there many times, where we think that something is more complicated than it really is.
Don't worry about it, just keep asking the questions.

JimB
 
Hi

An LC filter is ideally considered an 100% efficient filter which means it doesn't waste any energy. Now please have a look on this figure.

You can see that duty cycle is 50%. We can say that the pulse-wave source is supplying energy in form of different harmonics. By looking at the Fourier graph for Vin, we can see that DC=5V, H_1st=6.4V, H_2nd=4.8V, and so on; "H_1st" stands for first harmonic.

The cutoff frequency of the given LC filter is is 356 Hz.

We can see by looking at the Fourier graph for Vout that harmonics have been attenuated and DC component has almost passed as it is. Yes, I understand that the LC filter is attenuating those harmonics which means that their amplitude is reduced. But what is happening to the energy of those harmonics? The power spectrum is found by taking square of amplitude, i.e. V^2 in the given case like this. Where is that power going away? Perhaps, the filter converts 'oscillating' power of those harmonics into an RMS value! Please guide me. Thank you.

Regards
PG
 

Attachments

  • fourier_lc.jpg
    fourier_lc.jpg
    269.2 KB · Views: 566
Hi there PG,

When you ask a question like this where it is very theoretical it is best to first sit down and think about what would be the simplest case that, once figured out, would help to solve the more complicated case.

Here we have a buck circuit with an LC filter and resistive load. There is a diode, resistor, and PWM, but the question is one about harmonics and an LC filter, so no need for the diode nor the PWM to answer the question, because we only need to look at the LC filter and one single harmonic. This not only removes the non linear parts, it also simplifies the question overall because once we know what happens with one harmonic we know what happened to all of them.

So what we end up with is a sine (or cosine) wave source of 1v amplitude driving an LC filter with a resistive load, and because we can assume that the entire circuit scales for frequency, we can even use simple values like R=1, C=1, w=1, etc.
We might then vary w to look at one of the harmonics.

Because the question would apply to even simpler circuits, we can even simplify the circuit more yet. For example, a simple RC filter driven with sinusoidal source, maybe also with resistive load R2. See what happens to one of the harmonics.

Since we know that energy can not be lost in a pure capacitance (or inductance) it has to be lost in the resistive elements.
Also, it is possible and likely that power flows back into the source during some periods of time due to phase shifts.

Try thinking about this and see what you can come up with.
 
Last edited:
I agree with MrAl.

When I first saw this new question, I thought that you were trying to understand the operation of a buck converter.
My thought was that you would be better looking at it in the time domain rather than the frequency domain.

If you want to understand the operation of an LC filter, follow MrAls' suggestion.

JimB
 
Status
Not open for further replies.

New Articles From Microcontroller Tips

Back
Top