Electro Tech is an online community (with over 170,000 members) who enjoy talking about and building electronic circuits, projects and gadgets. To participate you need to register. Registration is free. Click here to register now.
Welcome to our site! Electro Tech is an online community (with over 170,000 members) who enjoy talking about and building electronic circuits, projects and gadgets. To participate you need to register. Registration is free. Click here to register now.
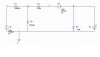
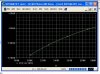
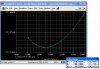
what i mean is that; i want to vary the value of R load and plot the power dissipated to load resistance. hence be able to see the maximum power dissipated to the load.
what i mean is that; i want to vary the value of R load and plot the power dissipated to load resistance. hence be able to see the maximum power dissipated to the load.
Do you mean the peak power or the average power?
The peak power can be had the way Hero told you about.
If you need the average power you would integrate i(t)*e(t)
over all time, which is the same as using an RC filter on i(t)*e(t)
where the time constant is large compared to the change in
the amplitude of the waveform.
This site uses cookies to help personalise content, tailor your experience and to keep you logged in if you register.
By continuing to use this site, you are consenting to our use of cookies.