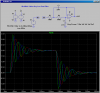
Continue to Site

Welcome to our site!

Electro Tech is an online community (with over 170,000 members) who enjoy talking about and building electronic circuits, projects and gadgets. To participate you need to register. Registration is free. Click here to register now.

  • Welcome to our site! Electro Tech is an online community (with over 170,000 members) who enjoy talking about and building electronic circuits, projects and gadgets. To participate you need to register. Registration is free. Click here to register now.

I want to demonstrate step response of a second order RLC circuit...

Status
Not open for further replies.
Hello,


Do you want the current response or an output voltage response?
 
Hello,


Do you want the current response or an output voltage response?
What I want is a unitary transfer function which is independent of the system; it can even be mechanical system.

[latex]H(s)\,=\,\frac{w_n^2}{s^2\,+\,2\zeta w_ns\,+\,w_n^2}\\
where:\\
w_n:\,natural\,frequency\\
\zeta:\,damping\,ratio[/latex]

But if you want to consider a particular circuit, you may think a series RLC circuit. Input is the source voltage applied to the entire circuit, and the output is the voltage on capacitor.

[latex]H(s)\,=\,\frac{\frac{1}{LC}}{s^2\,+\,\frac{R}{L}s\,+\,\frac{1}{LC}}\\
in\,this\,case:\\
w_n\,=\,\frac{1}{\sqrt{LC}}\\
\zeta\,=\,\frac{R}{2}\sqrt{\frac{C}{L}}[/latex]

I just need a natural frequency around ten times the souce frequency (i.e.; 100kHz = 2π100krad/s), and a damping ratio around 0.7~0.8. However, whatever I tried in an hour, I couldn't make it under-damped.
 
Last edited:
Hello again,


You have the transfer function correct, but you might multiply the numerator by E to include the amplitude of the square wave.

The underdamped case occurs when the discriminate of the denominator equation is less than zero, ie negative. In other words, you have the underdamped case when:

(C*R^2-4*L) < 0

You only need to satisfy that equation to get an underdamped case. In the real circuit this only involves changing one or two component values.

Also of interest is the critically damped case:
(C*R^2-4*L) = 0

and the overdamped case:
(C*R^2-4*L) > 0

A real circuit example for the underdamped case would be the series circuit you described with output voltage taken across the cap, with values:
R=5
L=10uH
C=0.1uf
Input voltage amplitude E could be just about any positive value like 1,2,5,10, etc.
With a 10kHz input square wave you'll get an output similar to the wave you have drawn in your attachment.

Also of interest is the current response (current through each element), who's transfer function has the same denominator so the same rules apply.
 
Last edited:
You only need to satisfy that equation to get an underdamped case. In the real circuit this only involves changing one or two component values.

Thanks for the answer, I did the calculations but they didn't worked. I tried different values with non worked. Actually for once I made it a very nice under damped response, but later I messed it up again and lost those values.

As a trivial information, my code is:
Code:
	// General constants
	const long double dbSignalPeriod	= 0.0001;
	const long double dbSamplingPeriod	= dbSignalPeriod / 1000.0;	// 1000 samples in a period
	const long double dbNumberOfPeriods	= 5.0;				// Number of periods to plot
	
	ControlSystemBlock RCFilter(PolynomialFraction<long double>(1, 2, 1.0, 1.0, 0.00001),  dbSamplingPeriod);

	long double R=180, L=0.0001, C=0.0000001;	// Circuit elements
	long double Wn = 1.0/Math::pow(L*C, 0.5) , dr = Math::pow(C/L, 0.5)*R/2.0;	// Natural frequency and damping ratio
	ControlSystemBlock RLCFilter(PolynomialFraction<long double>(1, 3, Wn*Wn, Wn*Wn, 2*dr*Wn, 1.0),  dbSamplingPeriod);
	
	MatlabPlotter Plotting;
	MatlabPlotter::GraphId Graph1, Graph2, Graph3;
	Graph1 = Plotting.AddGraph();
	Graph2 = Plotting.AddGraph();
	Graph3 = Plotting.AddGraph();
	
	long double dbSignalValue;
	for (long double i=0; i<dbNumberOfPeriods*dbSignalPeriod ; i+=dbSamplingPeriod)
	{
		dbSignalValue = (Math::IsEven(static_cast<int64_t>(i / dbSignalPeriod))) ? 1.0 : -1.0;
		Plotting.AddData(Graph1, i, dbSignalValue);
		Plotting.AddData(Graph2, i, RCFilter.SendInput(dbSignalValue));
		Plotting.AddData(Graph3, i, RLCFilter.SendInput(/*10000000000.0**/dbSignalValue));
	}
	
// 	Plotting.SetLineType(Graph1, MatlabGraph::LINE_TYPES::LT_DASHED);
// 	Plotting.SetLineType(Graph2, MatlabGraph::LINE_TYPES::LT_SOLID);
	Plotting.SetLineColor(Graph1, MatlabGraph::LINE_COLORS::LC_BLUE);
	Plotting.SetLineColor(Graph2, MatlabGraph::LINE_COLORS::LC_RED);
	Plotting.SetLineColor(Graph3, MatlabGraph::LINE_COLORS::LC_GREEN);
	
	//Plotting.SetXYLimits(-0.1, 7.0, -1.5, 1.5);
	Plotting.SetWindowTitle("MatlabPlotter - by hkBattousai");
	Plotting.SetPlottingTitle("Square wave applied to RC and RLC filters");
	Plotting.SetXLabel("time");
	Plotting.SetYLabel("amplitude");
	
	//std::cout << Plotting.GetPlotCommand() << std::endl;
	Plotting.ExportPlotCommandToFile(L"C:\\Users\\hkBattousai\\Documents\\MATLAB\\ExportedPlotData.m", true);

The green plotting is the step response which is I'm trying to make look good.
**broken link removed**
 
Hi again,

In order to demonstrate this you need to use a clean square wave input, not a square wave that is partially exponential as your drawing shows. Im not sure if this is what you are doing or not though, so you'll have to check. Make sure the input is a nice clean square wave with sharp corners.

You'll also note that when going from underdamped to critically damped you'll go through a no man's land, where the underdamped will look like a pseudo critically damped. This means you will have to change the values a little more to see the wave you are looking for. Try lowering R as that usually works if you're close already.

I would suggest first trying the values i gave you as these values will definitely work if your input is a true square wave of any positive amplitude (see attached drawing)...
 

Attachments

  • Underdamped-01.gif
    Underdamped-01.gif
    9.9 KB · Views: 958
Last edited:
In order to demonstrate this you need to use a clean square wave input, not a square wave that is partially exponential as your drawing shows.
My square wave is the blue plotting. Its flat upper part is not visible because of Matlab image exporter. I think you confused it with the red one; it is a different plotting, it is step response of an RC circuit.
 
A Sallen-Key Low-Pass filter, modified by changing one capacitor exhibits the peaking you are seeking. Note how changing C1 effects the damping...


I'll let you write the equations to solve this in the general case...
 

Attachments

  • 2ndOrder.png
    2ndOrder.png
    39.3 KB · Views: 348
My square wave is the blue plotting. Its flat upper part is not visible because of Matlab image exporter. I think you confused it with the red one; it is a different plotting, it is step response of an RC circuit.

Hello again,


Oh ok, well that's fine then. If something else is wrong then i guess you'll have to find out what it is. I gave you component values that clearly illustrate a second order under damped case so you should be able to get that to work.
 
Status
Not open for further replies.

Latest threads

Back
Top