Hi,
It appears that you were trying to do the first one (C=1nf, R1=100k, R2=10k) so we'll do that one first. You'll want to note that the zero and the pole cause opposite sign slopes, one +20db/decade and the other -20db/decade.
The transfer function Hs is:
Hs=(s*C*R1*R2+R2)/(s*C*R1*R2+R2+R1)
At zero frequency the gain K is equal to:
K=R2/(R1+R2)
and dividing numerator and denominator by C*R1*R2 we get:
Numerator: N=1/(C*R1)+s
Denominator: D=1/(C*R2)+1/(C*R1)+s
So we have constant gain:
K=1/11
and the numerator is:
N=s+10000
and the denominator is:
D=s+110000
Thus we have a zero at w=10k and a pole at w=110k, and constant gain -21db.
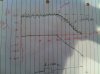
The two frequencies are 10k and 110k, so we start out at w=0 with the constant gain of -21db which is a straight horizontal line (like you have drawn) and at the frequency of 10k we have a zero so we get a slope of +20db/decade starting at 10k. This continues until we reach 110k and there we have another frequency of 110k which is a pole so we get a slope of -20db/decade starting at 110k, and this added to the previous slope means we again get a line with a slope of 0 which is a horizontal line.
So the plot looks like a horizontal line at -21db that goes from w=0 to w=10k, then slopes upward at +20db/decade, then at 110k it becomes a horizontal line again. Since the slope of the upward line is +20db/decade and it starts at -21db and goes from 10k to 110k, that means it goes upward about +22db and this means we end up at +1db, but the horizontal portion from there is around 0db because since the cap conducts much more than the 10k resistor at infinite frequency, the response is clearly 0db above w=110k. Note that since the distance from the 10k to 110k is really 1.1 decades, we would multiply 20db times 1.1 and get 22db as the rise so this would lead us to +1db rather than 0db. But the quick check with the cap and 10k resistor shows this to really be 0db. So we've corrected this a little by doing that.
Also note that when you get a pole after a zero it cancels out the slope of the zero because the pole has the exact opposite slope as the zero.
So the plot looks like this:
Code:
   0                 ------------------
                    /
                   /
                  /
                 /
 -21  -----------
      0        10k  110k              +inf
")
")
