Continue to Site

Welcome to our site!

Electro Tech is an online community (with over 170,000 members) who enjoy talking about and building electronic circuits, projects and gadgets. To participate you need to register. Registration is free. Click here to register now.

  • Welcome to our site! Electro Tech is an online community (with over 170,000 members) who enjoy talking about and building electronic circuits, projects and gadgets. To participate you need to register. Registration is free. Click here to register now.

[solved] Parallelled resistors - allowed to measure only one - question about calculate actual values for all

Status
Not open for further replies.

Grossel

Well-Known Member
Hi.

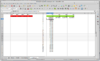
Have a earth grounding, it is possible to measure each point as the figures show.

So what I'm looking for is a method to determine the real value for each resistance.

Since it's many years I went to school, I'm rusty. A couple of months ago I tried to set up a formula (his was for only three resistors). I tried to turn the general formula so to isolate the series resistor and hopefully get 3 formulas with 3 unknown. However when I tried to insert the formulas into each other, it grew out so much that it just get into a massive mess of nothing. Unfortunately I've thrown away the paper I wrote that onto.

Anyway - if excluding circuit simulation software, is there a smart way of calculate the resistance of each resistor based on the figures ?

Hopefully there exist a method that I can apply when having ten or more resistors in similar setup . . .
 

Attachments

  • measure-R1.png
    measure-R1.png
    9.6 KB · Views: 316
  • measure-R2.png
    measure-R2.png
    9.9 KB · Views: 312
  • measure-R3.png
    measure-R3.png
    9.9 KB · Views: 305
  • measure-R4.png
    measure-R4.png
    9.6 KB · Views: 305
you know the formulas for:
Series: R=R1+R2+.....Rn
Parallel: 1/R = 1/(1/R1+1/R2...+1/Rn)

I can see where it got messy. See: https://www.wolframalpha.com/input/?i=+1/R2+=+1/(1/R1+1/R2+1/R3);++solve+for+R2

If your thing was a circuit, you can use loop equations. You would draw clockwise "loops" of i1 through In.
and the V=(I1-I2)*R1; 0=(I2-I3)*R2 etc.

You would then develop a set of equations. Not sure how that works for the equivalent resistance.

Keithley Tektronix has a note about 5 terminal resistance measurements. Take a look at that too.
 
The loop equations should still work for Req. Don't draw in Req, but rather get the equation for V across the network and I through the network and assign the ratio to Req.
 
Maybe I am missing some detail here, but in each of the four situations in your pictures, one of the resistors is in series with the other three in parallel.
So, instead of measuring the series group, why not measure the individual resistor on its own?

Like this:
1621625846806.png


JimB
 
Maybe I am missing some detail here
Jeah, if it just had been that easy.

Ok the practically application is to use a current clamp with an instrument that is capable to do direct measurement of resistance in a wire (I don't know the english term for this apparatus). Therefore one can use this current clamp/injector to measure the resistance of earth electrode for a sight.
However, the measurement doesn't give the true resistance for that single earth electrode - because an additional resistance of the parallell resistance of the other earth electrodes on sight.
 
OK, having studied the link from KISS, I think I now understand the problem.

The measuring tool will measure one leg of a multi-leg earthing system, but the measured resistance for that one leg will be the leg resistance in series with all the other legs connected in parallel.
This may seem an odd way of measuring, but if the measured resistance of a leg is below the maximum resistance allowed for that leg, then the leg is within specification. The measurement technique will always read a higher resistance that the resistance of the individual leg which is measured.

That sounds very complicated, but I cannot explain it any simpler.

What Grossel wants to do, is to calculate the true resistance of each leg.
This can get messy.

If we start the analysis with a simple arrangement of three resistors, and we measure R1, we effectively measure (R1 + R2//R3) which we will call RT1.
1621694177155.png


Using a bit of maths, we can make an expression for RT1 in terms of R1, R2 and R3
1621694433256.png


This can be manipulated to give R1 in terms of RT1, R2 and R3.
We can also derive expressions for R2 and R3.

1621694582134.png


If we try and use these expressions as simultaneous equations to find R1, R2 and R3, we end up going around in circles and getting no where.

We need to use a bit of mathematical guess work and repetition known as iteration.
This is best done with a computer program or we can use something like MS Excel.

1621695192977.png


In this spreadsheet,
the measured resistance values are in the red cells
the guesstimated true resistance values for R1, R2 and R3 are in the green cells
the blue cells show the true values for R1, R2 and R3 at each iteration.

The first line of the iteration (iteration number 1) takes the red values of RT1 to RT3 and the green values of R1 to R3, and calculates new values for R1 to R3.
The second line of the iteration (iteration number 2) takes the red values of RT1 to RT3 and the blue values of R1 to R3 from the first line of iteration, and calculates new values for R1 to R3.
The third line of the iteration (iteration number 3) takes the red values of RT1 to RT3 and the blue values of R1 to R3 from the second line of iteration, and calculates new values for R1 to R3.
And so on down to iteration number 20.

Looking at the graph, we see that the values of R1, R2 and R3 oscillate about a bit and then settle down to 5, 6 and 7 (Ohms).
These are the values I used to calculate the 8.32, 8.91 and 9.72 measured values for RT1 to RT3.

This method can easily be expanded up to N resistors, by having more columns for RT1 to RTn and R1 to Rn, with the appropriate expressions for R1 etc as written above but with terms up to Rn.

I hope that this almost makes sense.

JimB
 
JimB - Thank you for telling me about the Excel Iteration. I didn't know I didn't know this method (except GeoGebra that have a somewhat similat feature but for visible curves that should fit to a range of coordinates).

This method is new for me, and I use Libre Office, probably also having this feature. I now just need to get into the concept and try to learn how to use. If I find a tutorial for Excel then I understand the principle and probably can do the same in Calc.
Like - I see the result of your spreadsheet but not the method to make it there.

[edit]
Ok, the tool I should use for this is called Solver, Libre office help-page.
 
Last edited:
Iteration is not a feature of Excel (as far as I know), it is just the way I wrote the configuration into the cells.

The graphs are part of Excel, I just put them in there to illustrate what is happening.

JimB
 
OK,, I watched this tutorial for Libre Office Calc Solver. However, the limitation is that there can be only one cell (multiple variables but only one answer). Since this have multiple variable inputs, that cannot be used.
I've just read some web sites on iterative calculation in Excel, I'll se if I can do that in Calc too.
 
The second line of the iteration (iteration number 2) takes the red values of RT1 to RT3 and the blue values of R1 to R3 from the first line of iteration, and calculates new values for R1 to R3.
Ok, I can follow you until this, but here it stop. I'm not able to dig up such a tutorial online that I can follow further. This is because spreadsheet iteration is new for me and I'm simply not confident about the concept yet.

[edit]
After some further looking at online video tutorials, it seems that there are two major problems:
  • Your example are orders of magnitudes more advanced that those examples online.
  • And - most videos only cover the "where to find the option to enable iteratiion calculations" and nothing more.

[edit 2]
This is so far I got, it's wrong obvious. Attach both the screenshot and the ods spreadsheed (remove the zip extension)
 

Attachments

  • beregnet-oppmålt_ITERASJON.ods.zip
    19.7 KB · Views: 288
  • Screenshot at 2021-05-23 02-08-10.png
    Screenshot at 2021-05-23 02-08-10.png
    161.8 KB · Views: 284
Last edited:
Have a look at this.
I have set the spreadsheet to show the formulas in each cell.
This may help you to understand what I am doing in each cell.

1621741085037.png


JimB
 
By using a high-powered mathematical software (Mathematica), we can get a solution for the 3 simultaneous equations:
GroundResistance1.png


However, trying for a solution with more than 3 ground rods didn't work. Mathematica ran for 5 minutes with no solution, so I stopped it. I think a symbolic solution would give intractable sized expressions as solutions.

But, a numerical solution worked. The solution is not unique, and Mathematica found a lot of solutions for the case of 7 ground rods where all the measured values are 10 ohms except for the seventh which is 100 ohms. Only one of the solutions has all positive values for the exact values. It is the one which has a value of 98.6072 in the seventh column. It took Mathematica 3 seconds to find these solutions. I suspect that the case of 10 ground rods might have a LOT of solutions.

GroundResistance2.png
 
Jim B - Thank you very much for sharing this way of working with spread sheet :D

Turns out same rules applies for Libre Office Calc, and I was able to solve for 4 rods.

Also, reading what The Electrician wrotes, get me wondering how many rods it is the upper limit for a spread sheet (assuming enough RAM of course). I assume the spread sheet application settings for adjusting numbers of iterations have a huge impact on this.

Attaching the working .ods spreadsheet file (must be renamed because I can only upload if .zip extension) for 4 rods.
 

Attachments

  • beregnet-oppmålt_ITERASJON-solution.ods.zip
    26 KB · Views: 261
Also, reading what The Electrician wrotes, get me wondering how many rods it is the upper limit for a spread sheet (assuming enough RAM of course). I assume the spread sheet application settings for adjusting numbers of iterations have a huge impact on this.

Considering how many solutions there are for the 7 rod case, a problem with an iterative method for many rod cases is that the iterative process might converge to any one of the solutions. The fact that the undesired solutions always have at least one of the Rx values as negative can probably used to steer the iterative process away from them.
 
Status
Not open for further replies.

New Articles From Microcontroller Tips

Back
Top