Hi,
On the presumption that this screenshot is from the following video: **broken link removed**
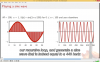
1) 'M' is the delay (see timepoint 12:17 of the video)
2) In the image, the LHS waveform represents a single 440 Hertz wave. The numbers along the x-axis represent values of M, the delay. All of this is explained at timepoint 14:08 and onwards, in the video.