tomizett
Active Member
Hi All,
Recently wrote this little script for Octave/Matlab and thought I'd share it here in case it is of any use. I had a look to see if there was a native way to extract the data I wanted (or if someone had already writen a post-processor) but couldn't find anything. If another (better) way exists of doing this, please fee free to let us know here!
This script is intended for situations where you are simulating a time-variant circuit with a .TRAN and would like to see how varying some paramiter using a .STEP affects a circuit output, which may be varying over time.
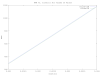
For instance, you may have designed an SMPS and wish to plot output voltage vs. load. Obviously you'll need to simulate with .TRAN and .STEP the load. While you can read the average output-node voltage with a .MEASURE, I can't see (but this might just be me) a satisfactory way of plotting this relationship.
This script can deal with two independent .STEPs so you could, for instance, plot line regulation for various different load currents.
To use it, first export the results of the simulations to a text file - with the LTspice plot window selected, select "export" from the file menu. Then, in Octave/Matlab, just run the "ltpost" script followed by the name of the text file.
Be warned, it's pretty rough-and-ready code, and won't be at all robust if the export format from LTspice changes!
Recently wrote this little script for Octave/Matlab and thought I'd share it here in case it is of any use. I had a look to see if there was a native way to extract the data I wanted (or if someone had already writen a post-processor) but couldn't find anything. If another (better) way exists of doing this, please fee free to let us know here!
This script is intended for situations where you are simulating a time-variant circuit with a .TRAN and would like to see how varying some paramiter using a .STEP affects a circuit output, which may be varying over time.
For instance, you may have designed an SMPS and wish to plot output voltage vs. load. Obviously you'll need to simulate with .TRAN and .STEP the load. While you can read the average output-node voltage with a .MEASURE, I can't see (but this might just be me) a satisfactory way of plotting this relationship.
This script can deal with two independent .STEPs so you could, for instance, plot line regulation for various different load currents.
To use it, first export the results of the simulations to a text file - with the LTspice plot window selected, select "export" from the file menu. Then, in Octave/Matlab, just run the "ltpost" script followed by the name of the text file.
Be warned, it's pretty rough-and-ready code, and won't be at all robust if the export format from LTspice changes!