Photoresistor luminance measurement in the form of dot motion on OLED12864 screen display effect.
Experimental equipment
Mango controller (Arduino UNO compatible controller)
One expansion board
Several double-ended bus bars
Photoresistor module
Miscrodino OLED (12864 display with I2C interface)/or other LCD
Connections
Arduino GND to OLED GND
Arduino 3.3V to OLED VCC
Arduino A4 to OLED SDA
Arduino A5 to OLED SCL
Arduino GND to GND of photoresistor module
Arduino VCC to VCC of photoresistor module
Arduino A0 connects to the check interface of the photoresistor OUT
Principle of photoresistor module
Coordinate system depiction
In the screen of (10, 60) as the origin, the horizontal line Y = 10
the firm flat line X=60
Use drawLine() to draw two lines
Draw the small arrow again
A horizontal line with (128, 60) points, firm line with (10,0) points to draw small arrows
Draw a straight line in the middle of the screen for easy viewing
Continue adding tick marks
Also need text description
Define the integer variable sensor value to read the value of the analog port A0 and map the value of sensor values to [64-0] (the height of the screen is 64) and pass it to the integer variable outValue.
After mapping, the output value is higher when the brightness is high and lower when the height is low, in order to be in line with human habits.
Print out the result on the serial port
To avoid refreshing too fast,
Each depiction is delayed by 0.1 seconds, and then another depiction is done.
The Arduino code is as follows.
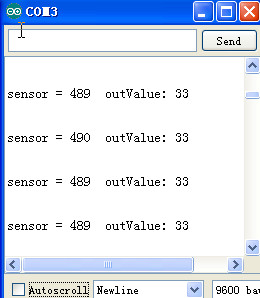
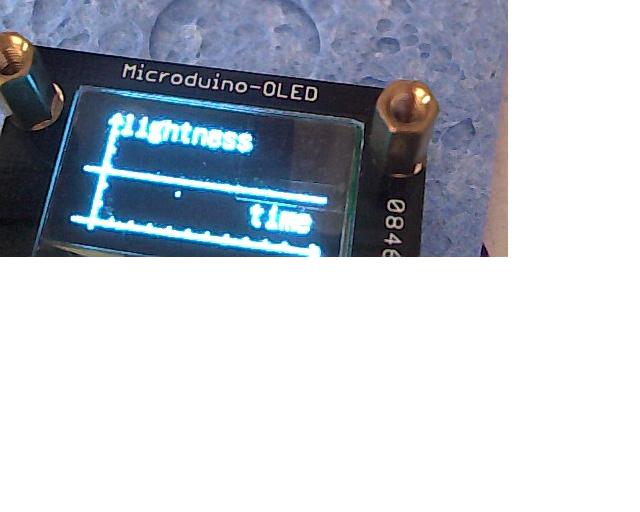
The program running effect.
Test results during daytime
Place your hand on top of the photoresistor and block it with the shadow of your hand, and the bright spot bounces near the X-axis.
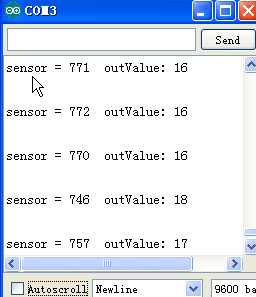
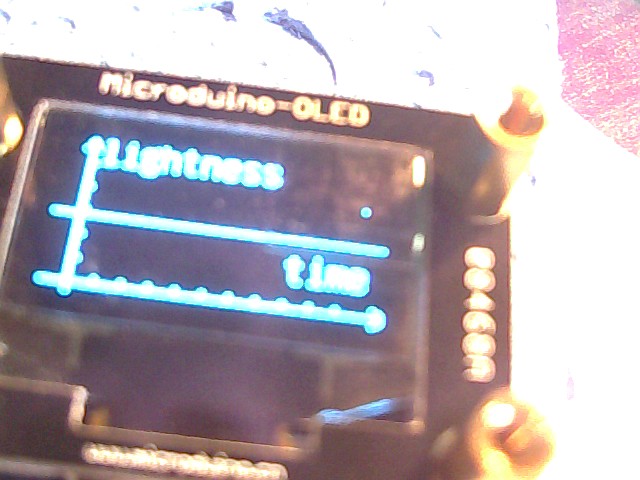
After turning on the lights
Experimental equipment
Mango controller (Arduino UNO compatible controller)
One expansion board
Several double-ended bus bars
Photoresistor module
Miscrodino OLED (12864 display with I2C interface)/or other LCD
Connections
Arduino GND to OLED GND
Arduino 3.3V to OLED VCC
Arduino A4 to OLED SDA
Arduino A5 to OLED SCL
Arduino GND to GND of photoresistor module
Arduino VCC to VCC of photoresistor module
Arduino A0 connects to the check interface of the photoresistor OUT
Principle of photoresistor module
Coordinate system depiction
In the screen of (10, 60) as the origin, the horizontal line Y = 10
the firm flat line X=60
Use drawLine() to draw two lines
Code:
 u8g.drawLine(0,60,128,60);//draw the X-axis of the coordinate system
u8g.drawLine(10,0,10,64);//draws the Y-axis of the coordinate system
Draw the small arrow again
A horizontal line with (128, 60) points, firm line with (10,0) points to draw small arrows
Code:
  u8g.drawLine(10,0,7,4);//draw the small arrow
  u8g.drawLine(10,0,13,4);
  u8g.drawLine(128,60,124,63);//another small arrow
  u8g.drawLine(128,60,124,57);
Draw a straight line in the middle of the screen for easy viewing
Code:
u8g.drawLine(0,32,128,32);Continue adding tick marks
Code:
  //add tick marks to the horizontal axis
  u8g.drawLine(20,60,20,58);//the first scale
  u8g.drawLine(30,60,30,58);//the second tick line
  u8g.drawLine(40,60,40,58);//third scale
  u8g.drawLine(50,60,50,58);//fourth tick
  u8g.drawLine(60,60,60,58);//the fifth tick
  u8g.drawLine(70,60,70,58);//sixth scale
  u8g.drawLine(80,60,80,58);//the seventh scale
  u8g.drawLine(90,60,90,58);//the eighth scale
  u8g.drawLine(100,60,100,58);//the ninth scale
  u8g.drawLine(110,60,110,58);//the tenth scale

  // firm linear scale
  u8g.drawLine(10,50,12,50);//first scale
  u8g.drawLine(10,40,12,40);//second scale
  u8g.drawLine(10,30,12,30);//third scale
  u8g.drawLine(10,20,12,20);//fourth tick
  u8g.drawLine(10,10,12,10);//the fifth tick
Also need text description
Code:
  //write text
  u8g.setFont(u8g_font_unifont);
  u8g.drawStr(90,50, "time");
  u8g.drawStr(13,10, "lightness");
Define the integer variable sensor value to read the value of the analog port A0 and map the value of sensor values to [64-0] (the height of the screen is 64) and pass it to the integer variable outValue.
After mapping, the output value is higher when the brightness is high and lower when the height is low, in order to be in line with human habits.
Print out the result on the serial port
Code:
  // Print the result on the serial monitor
  Serial.print("sensor = " );
  Serial.print(sensorValue);
  Serial.print(" outValue: ");
  Serial.println(outValue);
Serial.println();
To avoid refreshing too fast,
Each depiction is delayed by 0.1 seconds, and then another depiction is done.
The Arduino code is as follows.
Code:
#include "U8glib.h"

U8GLIB_SSD1306_128X64 u8g(U8G_I2C_OPT_NONE); // HW SPI Com: CS = 10, A0 = 9 (Hardware Pins are SCK = 13 and MOSI = 11)
const int analogInPin = A0; // connect analog port input port A0 as voltmeter

int sensorValue = 0; // (Voltage data)) analog value
int outValue; // map the analog value to the desired range

u8g_uint_t x;

void draw_rect1(void)// draw a cross with the horizontal line at the bottom and the vertical line to the left
{
  //the origin of the coordinates is set in the center of the screen, for the convenience of seeing, the Y axis is set at the X = 10 position
  // the origin of the coordinates is (10, 60)
  u8g.drawLine(0,60,128,60);//draw the X-axis of the coordinate system
  u8g.drawLine(10,0,10,64);//draw the Y-axis of the coordinate system
  //draw the line from (10,0) for the Y-axis small arrow and from (128,63) for the X-axis small arrow
  u8g.drawLine(10,0,7,4);//draw the small arrow
  u8g.drawLine(10,0,13,4);
  u8g.drawLine(128,60,124,63);//another small arrow
  u8g.drawLine(128,60,124,57);

  //add another middle line
  u8g.drawLine(0,32,128,32);

  //add a scale to the horizontal axis
  u8g.drawLine(20,60,20,58);//the first tick line
  u8g.drawLine(30,60,30,58);//the second scale
  u8g.drawLine(40,60,40,58);//third scale
  u8g.drawLine(50,60,50,58);//fourth tick
  u8g.drawLine(60,60,60,58);//the fifth tick
  u8g.drawLine(70,60,70,58);//sixth scale
  u8g.drawLine(80,60,80,58);//the seventh scale
  u8g.drawLine(90,60,90,58);//the eighth scale
  u8g.drawLine(100,60,100,58);//the ninth scale
  u8g.drawLine(110,60,110,58);//the tenth scale

  // firm linear scale
  u8g.drawLine(10,50,12,50);//first scale
  u8g.drawLine(10,40,12,40);//second tick line
  u8g.drawLine(10,30,12,30);//third scale
  u8g.drawLine(10,20,12,20);//fourth tick
  u8g.drawLine(10,10,12,10);//the fifth tick

  //write text
  u8g.setFont(u8g_font_unifont);
  u8g.drawStr(90,50, "time");
  u8g.drawStr(13,10, "lightness");
}

void mydraw( u8g_uint_t x)
{
  draw_rect1();

  u8g_uint_t y;

  y=outValue;
  u8g.drawPixel(x+10,y);


}

void setup() {
  // Initialize the serial communication rate of 9600 bits per second:
  Serial.begin(9600);


}

void loop() {
  u8g.firstPage();
  do {
    // Read the analog value:
    sensorValue = analogRead(analogInPin);
    outValue=map(sensorValue,0,1023,63,0);
    //print the result on the serial monitor
    Serial.print("sensor = " );
    Serial.print(sensorValue);
    Serial.print(" outValue: ");
    Serial.println(outValue);
    Serial.println();


    mydraw(x);

  }
  while( u8g.nextPage() );

  x=x+1;
  if (x==128)
  {
    x=1;
  }

  // wait 300 ms before the next loop (the original example was 2 ms)
  delay(100);
}
The program running effect.
Test results during daytime
Place your hand on top of the photoresistor and block it with the shadow of your hand, and the bright spot bounces near the X-axis.
After turning on the lights
Last edited by a moderator:
