Continue to Site

Welcome to our site!

Electro Tech is an online community (with over 170,000 members) who enjoy talking about and building electronic circuits, projects and gadgets. To participate you need to register. Registration is free. Click here to register now.

  • Welcome to our site! Electro Tech is an online community (with over 170,000 members) who enjoy talking about and building electronic circuits, projects and gadgets. To participate you need to register. Registration is free. Click here to register now.

learning basics of Matlab

Status
Not open for further replies.
Hi Doug

Is this possible to have colored/bold text output in the command prompt? Suppose I have a script and when it's run, it says "The Job is Done!" at the end. When I worked with C++ I remember there were ways to make the output colored. Kindly let me know if it's possible. Thank you.

Regards
PG

PS: I have found this function but it's not working. It does not colorize the text. However, I can have red color using the line below.
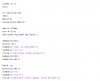
Code:
fprintf(2,'\nHello world\n'); % red output
 
Last edited:
Thanks, Doug.

I'm using R2011a (MATLAB 7.12). The cprintf() you linked to in last post works on my system too. Thanks for this. When I type, error 'Hello' , it does print "Hello" in red. But in my case, hypertext 'Hello', doesn't work. Could you please help? Thank you.

Regards
PG
 
You need to use the cprintf() function. Type cprintf in the matlab command prompt for instructions.

cprintf('hyper', 'followed %s','by');
 
Hi

In the code below I was trying to find numerator and denominator but both lines cause errors. Where do I have it wrong? Please help me. Thanks.

Code:
syms s;
sys2=zpk([-10, -60],[0, -40, -50, roots([1 7 100])', roots([1 6 90])'], [10^4]);
T_s=tf(sys2);
pretty(T_s);  % error line
[num,den]=numden(T_s) % error line
[r,p,k]=residue(num,den)

Regards
PG
 
Hi

I have been trying to write a code for sampling and quantization for last two days. I have figured out sampling part but need your help with quantization part. I have found this code but the problem is that I can't understand what is being done in quantization part, and I do believe the quantization code could be simpler because I need a straightforward code without embellishments. Moreover, I'm interested in 4-bit quantization and the desired number of samples could be 13. I want to do something similar to this. Please help me. Thanks.

Regards
PG
 

Attachments

  • sampling_code.jpg
    sampling_code.jpg
    40.9 KB · Views: 178
  • quantization.jpg
    quantization.jpg
    49.6 KB · Views: 181
I didn't try to understand the code (I hate figuring out other peoples code, especially when there are no comments )

But it seems to me that the "floor" function is suitable for quantization, and the fact that you are quantizing to integer values makes it easier. I'll give you the equation assuming inputs and outputs are decimal numbers, and if you need binary representations, I'll leave it to you to do the conversions.

For any function x(t), find the x-values at the sampled time values, and put them in the vector called "x". Then "x_quant": is the quantized value of the sample.

x_quant=max(0, min(15,floor(x)))

The min and max functions simply ensure that you are in the range of 0 to 15 for 4 bit numbers, and the floor function rounds the value down.
 
steveB's code is good for quantisation. You do need to bear in mind that x will have to be scaled before using floor to quantise, and then x_quant has has to be scaled by the reciprocal if you want it to have the same scale as the input signal. If you just want the values {0, 1, ..., 15}, then the second scaling is not required.
 
Thank you, Steve, Doug.

I'm sorry but I'm still not able to do it. I have tried and was able to move forward a bit.

Code:
x=[0:1/15:1]'; 
y=cos(2*pi*1*x)
stem(x,y)
round(y)   % don't you think using round() is better than using floor()?
% for conversion from decimal to binary we can use the function dec2bin(d,n)

I don't understand how, x_quant=max(0, min(15,floor(x))), works. For cosine function minimum value is going to be -1 and maximum +1 therefore to get 15 quantization levels (or, 4-bit quantization), we need to set quantization scale at {1-(-1)}/15=2/15. Please help me. Thank you.

Regards
PG
 
OK, dougy83 pointed out that you need to scale to get into the range, but in your case you seem to need to shift and scale to get the function in the 0 to 15 range. I wasn't really worried about this because your plot seemed to show a function already conditioned, but obviously I assumed the wrong thing.

So just shift your function so that it starts at zero and scale it so that in ends at 15.

Also, you can use the round function if you prefer. However, when i looked at your plot, it appeared that the values were being rounded down, which is what the floor function does.

EDIT: By the way, if you do condition your input signal by shifting and scaling, then you dont' need the min and max functions because there is no way for the signal to be out of bounds. Still, you may want to keep those in place as an extra error correction in case spurious data goes in by accident.
 
Last edited:
Now how do I scale and shift it?! :eek: Are you referring to time scaling and shifting? Even if you are, I still don't catch the logic here. Or, we can do this that you kindly provide the code and then we can discuss it so that I can understand its logic! :) If you don't have spare time then let's forget it. Anyway, grateful as always.

Regards
PG
 
This is the transfer function of the quantise function steve gave you. The x axis is the input 'x' and the y axis shows the output 'x_quant'
Code:
x = -10:.001:20;
x_quant=max(0, min(15,floor(x)));
plot(x, x_quant); xlabel('x'); ylabel('x_{quant}'); axis([-10 20 -10 20]); grid on;

Hopefully you can see the output only changes for values 0..15; outside this range the value is clipped. A sine wave between -1..+1 is only ever going to show an output of 0 and 1 (if you sample at exactly n.pi/4, where n is an odd integer). Therefore to quantise a sine wave to 15 levels, you have to scale it (i.e. multiply its amplitude) so that its span is 16 and its centre (offset / addition) is 8, before applying he quantisation.
 
PG,

I feel I need to offer some constructive criticism here. I sense that you feel your issue is trouble with coding in Matlab, but I don't think this is the main issue. When you code, you have two problems to deal with. The first is to figure out the method or algorithm that will solve the problem. The second, which should only follow after the first is complete, is to figure out the efficient way to implement that in whatever language you are using.

This isn't to say you shouldn't keep the language constraints in mind, because those do influence how you think, but think less about the language and more about the basic problem you are trying to solve.

The only exception to this general rule is when you have a programming language that has special features and functions that have presolved big pieces of what you are trying to do. Obviously in those cases you want to consider these shortcuts first.

But in this case you are trying to do general steps that most high level languages would do, and so you should focus on the algorithm first. It seems to me you skipped this important step because you in fact have no feel for how to solve this. This is clear because even after strong hints are given you are lost on how to proceed. I don't mean this in a harsh way, and I'm certain you can solve this with careful thought. But, as a student it is important to learn when careful thought is needed and in what direction the thought must be focused. Here I think you focused on figuring out coding before figuring out the algorithm. Or, you put the cart before the horse, so to speak.
 
Last edited:
Thank you, Doug, Steve.

@Steve: Your constructive criticism and advice is well taken. I'm sorry, and thanks.

I have tried again using a different logic and the result seems correct. Kindly give it a try.

Code:
x=[0:1/14:1]'; 
y=cos(2*pi*1*x);
q=[0:1/14:1];
subplot(211);
stem(q+1/14,y)

z=7.5*(y+1);
subplot(212);
stem(q+1/14,z)
w=round(z)
u=dec2bin(w,4)

Now I have to represent resulted binary sequence in this form and for this I need your help. Please help me with this. Thanks a lot.

Regards
PG
 

Attachments

  • cs_binary_plot.jpg
    cs_binary_plot.jpg
    8.4 KB · Views: 174
Last edited:
PG,

Thank you for taking criticism positively as intended. There is no need to apologize as this is a normal thing. If someone gives constructive criticism, it is usually because someone else gave it to them once, or because they learned the lesson the harder way, - by trial and many errors.

What you coded looks good to me.

Your new question I'm not sure about. I can't be sure exactly what the binary sequence is supposed to be. Specifications for design should be much clearer than this. Are you just trying to put the quantized numbers into a running stream of serial bits? If so, then you just need to establish an encoding scheme to represent the numbers, and then string them together in a serial format. What guidance have you been given about this? There are so many ways that this could be done from very simple and error-prone to complex and robust.
 
Thank you very much, Steve.

I have been given no guidance about it. The binary sequence is simply quantized bits for every sample interval. Actually I want to plot this in Matlab. Could you please help me with this? If my question is still not clear enough then kindly let me know. Thanks.

Regards
PG
 

Attachments

  • binary_plot.jpg
    binary_plot.jpg
    189.2 KB · Views: 174
OK, that plot makes it more clear. It looks like each data sample is 4 bits, so each time slot is allotted 4 bits in serial data. Then, the entire sting of sampled data is just streamed together without any additional coding bits to help orient the receiver. You only need to decide if you want to start with the most significant bit or the least significant bit.

Let's say you had the following data ...

t_0 1000
t_1 1001
t_2 0100

then the stream would be ... 100010010100 if you use most significant bits first and it would be 000110010010 if you use least significant bits first.
 
Thanks.

In the plot I have the most significant bits first so I will go for it. I still see no way how to do it in Matlab. Is there any plot function for it? Kindly let me know. Thank you.

Regards
PG
 
There is probably a really slick way to do this, if you give it a little thought. But, a slick method is not necessary; hence you can just do a brute force method by which you pick off each bit and store them in an array.

Then, you don't want to just plot this because you'll get finite slopes on the transitions. Since you want infinite slopes on the transitions, you will need to have two plot points for every time point.

This is a case where you need to just think and figure out a way. I quickly came up with something, but explaining it without code is too cumbersome and will result in a constant going back and forth for you to understand it. So, I'll give the code because I know you will work to figure it out and understand it and not just use it blindly.

Example code is as follows, but there are many ways. This is intended just as an example of one possible method and certainly not the most elegant way possible.

Code:
x=[0:1/15:1]'; 
y=cos(2*pi*1*x);
q=[0:1/15:1];
 
z=7.5*(y+1);
w=round(z);
u=dec2bin(w,4);

NN=max(size(z));         % NN is the number of data points or samples

D=w;                            % reasign the w variable to D

for ii=1:NN                    % This loop picks out the 4 bits per data point and stores them
    
    Temp=D(ii);               % every time through the loop, assign the data to the temporary variable Temp

    if Temp >7                 % this checks to see if the most significant bit is a 1
        A(4*(ii-1)+1)=1;    % if it is a 1, then store a 1 in the A vector
        Temp=Temp-8;      % now subtract 8 so that the most significant bit is set to 0 (this sets up the variable for the next check)
    else 
        A(4*(ii-1)+1)=0;    % if the most significant bit is 0, then store 0
    end

    if Temp >3                 % this checks to see if the next most significant bit is a 1
        A(4*(ii-1)+2)=1;    % if it is a 1, then store a 1 in the A vector
        Temp=Temp-4;       % now subtract 4 so that the bit is set to 0
    else 
        A(4*(ii-1)+2)=0;     % if the bit is 0, then store 0
    end

    if Temp >1                   % this checks to see if the third most significant bit is a 1
        A(4*(ii-1)+3)=1;     % if it is a 1, then store a 1 in the A vector
        Temp=Temp-2;       % now subtract 2 so that the bit is set to 0
    else 
        A(4*(ii-1)+3)=0;     % if the bit is 0, then store 0
    end

    if Temp >0                   % this checks to see if the least significant bit is a 1
        A(4*(ii-1)+4)=1;      % if it is a 1, then store a 1 in the A vector
    else 
        A(4*(ii-1)+4)=0;     % if the bit is 0, then store 0
    end
    
end

% note that the "stairs" command can be used rather than the following loop
for ii=1:max(size(A))   % This loop creates two plot points for every time point
    B(2*(ii-1)+1)=A(ii);
    B(2*(ii-1)+2)=A(ii);
    T(2*(ii-1)+1)=(ii-1);
    T(2*(ii-1)+2)=(ii);
end
plot(T,B)
 
Last edited:
The way I might do the plotting would make use of the variable 'u' that already contains all the bit data (it's simply reshaped into a vector).
Code:
x=[0:1/15:1]'; 
y=cos(2*pi*1*x);
q=[0:1/15:1];
 
z=7.5*(y+1);
w=round(z);
u=dec2bin(w,4);

% convert from ASCII to numbers, and reshape to a vector
bitstream = reshape(double(u' - '0'), 1, numel(u));   

stairs(0:length(bitstream)-1, bitstream)
 
Status
Not open for further replies.

Latest threads

New Articles From Microcontroller Tips

Back
Top