I had generated the nyquist plot for open loop 2exp^(-10s) it gave me a circle for radius 2 with center zero. But when make a open loop function nyquist plot the plot change and I dont understand why or how.
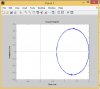
I am uploading graph for close loop (with 1 feedback) nyquist plot for step response. Please let me know how it can be plotted.
I am uploading graph for close loop (with 1 feedback) nyquist plot for step response. Please let me know how it can be plotted.