I'm still playing with DHT22 temperature/humidity sensors, and still trying to find a graphing solution I'm happy with - the one below is OK, apart from I can't get date/time X scale displays.
The two graphs are:
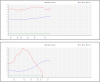
1) Top Graph - An ESP01 and DHT22, powered via a USB lead and FTDI board from my PC, it's actually in the attic sat about a foot from my left elbow at this very moment. It reads temperature, humidity, and internal supply voltage every ten minutes, and uploads via my WiFi to a PHP/MYSQL database.
2) Bottom Graph - a Wemos Mini and DHT22, powered from an AA sized Lithium Ion cell - this is in the eaves of the house, about six foot behind me a this moment. The 'wall' between eaves and attic is insulated, as is the ceiling below the eaves - one point of this exercise is to compare the readings under the eaves, and in the attic - to make me happy after the hard work fitting the insulation This runs the same software as the ESP01, and uploads to the same PHP/MYSQL database, with a different device ID.
Due to my mentioned graphing problems it currently displays only daily readings, and the X axis numbers are the sample reading numbers, auto-incremented as each reading is added to the database.
My question is regarding the bottom graph, and why it's died - fair enough I thought, the battery has run down - but a second look shows that it's still making temperature readings, while all others have ceased (these are humidity, battery voltage, WiFi connection, and RSSI). So I'm a little puzzled by that? Obviously I could just fetch the unit from under the eaves (but it's damned hot in there!) and measure the battery, but I'm loath to do that yet as it would negate the test somewhat. So has anyone got any ideas?, I thought perhaps the heat had got too much for it?, but why would the temperature reading still work?.
My current plan is to see what it's like in the morning, as it cools down over night.
For those who have read my previous DHT22 ramblings, I still have the HC-12 wireless ones running (using PIC16F1827's), and until recently these were being read by a PC and graphed via Lazarus (still with X-axis scaling problems though). However, last Sunday I spent some time programming a Wemos Mini, this now replaces the PC, it reads the DHT22/H-12's via it's own HC-12, and then uploads the readings direct to ThingSpeak - here's a link to a webpage displaying those readings:
Obviously the readings could just as easily be uploaded to my MYSQL database (and may well be later), but I'm still trying to find a nice graphing solution.
The two graphs are:
1) Top Graph - An ESP01 and DHT22, powered via a USB lead and FTDI board from my PC, it's actually in the attic sat about a foot from my left elbow at this very moment. It reads temperature, humidity, and internal supply voltage every ten minutes, and uploads via my WiFi to a PHP/MYSQL database.
2) Bottom Graph - a Wemos Mini and DHT22, powered from an AA sized Lithium Ion cell - this is in the eaves of the house, about six foot behind me a this moment. The 'wall' between eaves and attic is insulated, as is the ceiling below the eaves - one point of this exercise is to compare the readings under the eaves, and in the attic - to make me happy after the hard work fitting the insulation
This runs the same software as the ESP01, and uploads to the same PHP/MYSQL database, with a different device ID.Due to my mentioned graphing problems it currently displays only daily readings, and the X axis numbers are the sample reading numbers, auto-incremented as each reading is added to the database.
My question is regarding the bottom graph, and why it's died - fair enough I thought, the battery has run down - but a second look shows that it's still making temperature readings, while all others have ceased (these are humidity, battery voltage, WiFi connection, and RSSI). So I'm a little puzzled by that? Obviously I could just fetch the unit from under the eaves (but it's damned hot in there!
) and measure the battery, but I'm loath to do that yet as it would negate the test somewhat. So has anyone got any ideas?, I thought perhaps the heat had got too much for it?, but why would the temperature reading still work?.My current plan is to see what it's like in the morning, as it cools down over night.
For those who have read my previous DHT22 ramblings, I still have the HC-12 wireless ones running (using PIC16F1827's), and until recently these were being read by a PC and graphed via Lazarus (still with X-axis scaling problems though). However, last Sunday I spent some time programming a Wemos Mini, this now replaces the PC, it reads the DHT22/H-12's via it's own HC-12, and then uploads the readings direct to ThingSpeak - here's a link to a webpage displaying those readings:
Obviously the readings could just as easily be uploaded to my MYSQL database (and may well be later), but I'm still trying to find a nice graphing solution.