Continue to Site

Welcome to our site!

Electro Tech is an online community (with over 170,000 members) who enjoy talking about and building electronic circuits, projects and gadgets. To participate you need to register. Registration is free. Click here to register now.

  • Welcome to our site! Electro Tech is an online community (with over 170,000 members) who enjoy talking about and building electronic circuits, projects and gadgets. To participate you need to register. Registration is free. Click here to register now.

Electret mic and phone for heart and lung sound for telemedicine

Status
Not open for further replies.
This circuit needs an output volume control to avoid any clipping.
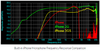
1) The output is already clipped as it leaves the second opamp.
2) What is the point in amplifying it only to then attenuate it? The entire second stage of amplification is entirely redundant.

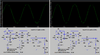
In the following image, the upper trace is taken at the "Audio Output" point. Note the "Max=1.079V"

The lower trace is taken at the output of the first opamp. Note the "Max=4.705V".

Contrast the spectra at both points.
1628635829605.png

when played into the mic input of a phone, the other end of the phone call will not hear any low frequency

But, if instead of sending the signal down the phone direct; you record it on the phone and send the resultant .wav/.acc.mp3/whaever file to the other persons phone, when they play it back, they will hear whatever was recorded.
 
Turn down the gain control so that the opamps produce no clipping.
The max gain of the first opamp is 1 + (1M/47k)= 22.3 times. Then if the heartbeat mic signal is 10mV peak the output from the first opamp will be 10mV x 22.3= 223mV peak but the opamp output can easily go as high as 4V to 4.5V peak.

The second opamp is a lowpass filter to cut frequencies at 2.5kHz and above. Its gain is only 1 + (33k/56k)= 1.59 times. Then its output will be 223mV x 1.6= 357mV peak which is not clipping at maximum gain.

Will the mic input on a phone record below 300Hz or above 3kHz?
 
As Buk suggested, I had just checked the fidelity of phone and ipad using the pink noise. Here are the results.

spectrum of pink noise
pinknoise.png


Spectrum of phone recording by built-in mic
phone_built-in_mic.png


and lavalier mic.
phone_lavalier_mic.png


Spectrum of ipad recording by built-in mic
ipad_built-in_mic.png


and lavalier mic
ipad_lavalier_mic.png


I am not too sure how to interpret these spectrum. I can see that frequency range is enhanced on both devices using lavalier mic and built-in mic of ipad is better than my phone (xiaomi 9t pro).

AG's suspicions could be correct here. Although lavalier mic can pick up low frequency content, its intensity is reduced. I might try again using more expensive lavalier mic. Will post the result later.

Boya lavalier mic with phone
phone_boya_mic.png


and ipad.
ipad_boya_mic.png
 
Last edited:
  • Like
Reactions: Buk
As Buk suggested, I had just checked the fidelity of phone and ipad using the pink noise. Here are the results.
...
I am not too sure how to interpret these spectrum. I can see that frequency range is enhanced on both devices using lavalier mic and built-in mic of ipad is better than my phone (xiaomi 9t pro).

Regardless of which external mic you are using, and which phone you are attaching it to, all those spectra show the same bands of deep attenuation*, this strongly indicates that it is the amplifier that is bad, not the mics, or the in-phone circuitry.

*put chunks of the spectra side-by-side and the attenuation bands become very obvious:
1628672337279.png


It's easy to see that the Boya mic has greater sensitivity, and the iphone is better at the lower end of the spectrum.

But you are testing the fidelity of the amplifier circuit more than the mics; and it is bad for your purpose.

I think you be better off repeating the pink noise experiment connecting the mics directly to the phone with no amplifier circuit to start with. This would require picking up the DC bias voltage from the earphone wires to drive the mic. I wish I had the chops to suggest how to do this correctly.
 
Buk I forgot to mention that this experiment was carried out without the preamp circuit that I built. I just plugged the mic to phone and ipad directly.

Based on your comment, it seems, however, that attenuation happens on the mobile devices. From side-by-side spectra, it looks as if frequency higher than 5.5 kHz is heavily attenuate. As frequency range for heart and lung sound is below 3kHz, these devices should be ok for use in telemedicine right?
 
Buk I forgot to mention that this experiment was carried out without the preamp circuit that I built. I just plugged the mic to phone and ipad directly.

Ah. A salient detail that makes my interpretation of the spectra you posted null and void. It happens :)

I'd like to see a picture of how you made the connections?

Based on your comment, it seems, however, that attenuation happens on the mobile devices.

The banding of the attenuation suggests (to me) that there is still clipping going on. I believe that the banding is indicative of the removal of the higher harmonics; but I have a little knowledge and no real expertise of these things. You should probably listen to the other guys here more than me.


From side-by-side spectra, it looks as if frequency higher than 5.5 kHz is heavily attenuate. As frequency range for heart and lung sound is below 3kHz, these devices should be ok for use in telemedicine right?

That makes sense to me also; but you should probably ask a doctor to compare what s/he hears live, versus what is recorded. I think that diagnosis of many conditions relies not on the main sound of the heart or lungs, but on the subtle details in the higher frequencies -- the sound of blood swirling (or not) around valves; wheezes and pops behind the main breath sounds. These are things that it would require a trained ear to detect; and detect the absence of in a digital recording. Way above my pay grade :)

Read the reviews at the bottom of this page for some idea of the details I mean.
 
I forgot to mention that this experiment was carried out without the preamp circuit that I built. I just plugged the mic to phone and ipad directly.

doldett. Are you 100% certain that the external mic was being detected and used?

Example: When you started the recorder app, did the app/OS imform you that an external mic was being used?

As seen in this yt vid here
and here
 
The lavalier and boya mics come with male trrs 3.5mm. So i just plugged them in phone and ipad.
IMG_20210811_170545.jpgIMG_20210811_170621.jpgIMG_20210811_170650.jpg

When I recorded the pink noise, I put the mic roughly the same distance from the speaker. Here is the speaker connected through the pc.
IMG_20210811_170708.jpg

doldett. Are you 100% certain that the external mic was being detected and used?

Example: When you started the recorder app, did the app/OS imform you that an external mic was being used?

I am sure that phone and ipad were using external mic, as the spectra of pink noise recorded by built-in mic and external mic are clearly different in my previous post.
 
Using pink noise to see the frequency response of a mic depends entirely on the quality of the speaker and the reverberations of the room it is in.
A sinewave played in almost any speaker will show if the mic preamp is clipping.

In the video, I barely understood what was being said very quickly by the guy from India in the echo chamber room. His mic should be directly at and close to his mouth to reduce the echoes. Maybe he can speak his own language and we can let Google do the translation.

It looks like the built-in mic of the phone is always turned on and the bands of the frequency response of other mics is caused by phase differences causing cancellation of some frequencies due to the distance between the mics.
 
the spectra of pink noise recorded by built-in mic and external mic are clearly different in my previous post.

Sorry doldett, Yes, they are clearly different. I only downloaded the external spectra, and forgot you'd posted those from the built-in.
 
I found a test of iPhone audio frequency response:
 

Attachments

  • smart phone audio frequency response.png
    smart phone audio frequency response.png
    60.2 KB · Views: 188
I found a test of iPhone audio frequency response:

Yeah. But, the iPhone 3S came out 13 y/a and the 3GS 12 y/a.

And the same page shows this graph of the frequency response of various external headset mics:
1628727510607.png


And I suspect things have come on a long way in the interim.

Which is born out by this test of the iPhone 11, 11 pro and Oppo X2 pro:
1628727746750.png

For reference, the above comes from here; and this explains their (incredibly detailed and very well designed) test procedures.
 
Last edited:
The recording on newer smartphones shows that the frequency response goes lower than 100Hz in "life" mode, maybe not in voice mode.
It might or might not record heartbeats well.
 
Thanks guys for very interesting info.

Just quick update. I am waiting for 3.5mm TRRS female sockets, which could get rid of problems that might associate with unshielded audio cable. I wanna make sure all the test results obtained in the future could only be related to the circuits.
 
AG. That circuit has real problems.
This is a very clean recording of the sound of a healthy 16 y/os normal heartbeat.
And this is what it looks like in a spectrum analyser:
Emily's normal heartbeat spectra.gif


This is what it looks like when played through your (simulated) circuit.
There are three graphs:
  1. The top one is taken just after input before the 10uF cap.
  2. The middle one, taken after the first opamp (set to minimal gain of 1.047) before the first 33k resistor.
  3. The bottom one taken at the output.
Emily's normal heartbeat through circuit.gif


The input shows very clearly the familiar lub-dub pulses.

Post amplification, the signal still shows (just) the two pulses, but there is massive resonance and the spectra has become totally distorted.

Post filter, the two pulse have almost completely merged, and the signal has been half-wave rectified and clipped. The spectra is almost random noise.

**broken link removed**

Doldett needs a new circuit tailored to his purpose.
 
Last edited:
Buk, I do not know what the different colors on the "waving flag" represent.
Your frequency response graphs are full of noise and oscillation.
Your input graph has the frequencies cutoff below 38Hz.
Your output graphs have severe high frequency oscillation between heartbeats but are fairly calm during each heartbeat possibly caused by the input level being way too high then the opamps are badly clipping.

Here is my LTspice simulation and repeated with better low frequencies:
 

Attachments

  • stethoscope.png
    stethoscope.png
    50 KB · Views: 200
Your oscillation is near 3kHz. Can the microphone hear the earphone?
 
Buk, I do not know what the different colors on the "waving flag" represent.
Green voltage versus time. Red frequency spectrum (FFT of the green).

Your frequency response graphs are full of noise and oscillation.

The aren't "frequency responses", the are frequency strength. Ie, the strengths of each frequency found in the input signal.

You don't claim to be an Audio Guru, but you don't understand FFT or how to read a spectragraph!? :confused:

Your input graph has the frequencies cutoff below 38Hz.

Utter baloney. Yo
1628877762161.png

The spectrum analysis runs up from zero; the signal strength at 25Hz is nearly identical to that at 38Hz and it is still pretty strong at 13Hz.

That's what is in the input heartbeat. I don't know how you cannot know this.

Your pair of green curves are meaningless.

You blamed the mics, the phones, the testing procedures, the graphs; the accent or was that the color of his skin.

What's next, the weather, Sunspots, Global warming?

Everything except your circuit; which is clearly wrong for this application.
 

Attachments

  • 1628877677424.png
    1628877677424.png
    16.4 KB · Views: 187
Buk, my frequency response curves that you said are "meaningless" are the same kind of curves used in the datasheets of microphones, speakers and amplifiers. They show the input or output level vs frequency. Since the voltage gain in my simulation is 22.3 x 1.6= 35.7 then I made the input of the simulation have 0.1V peak then the output peak of almost 3.6V is not saturated. 0.1V peak in an electret mic is produced by a very loud sound.

Now I show the perfect low distortion sinewaves at the output of my circuit with the same 0.1V peak input as my frequency response curves.
Before you said your FFT showed half-wave rectification and clipping. Mine shows perfectly symmetrical low distortion sinewaves.
 

Attachments

  • stethoscope sinewaves.png
    stethoscope sinewaves.png
    55.1 KB · Views: 197
Status
Not open for further replies.

Latest threads

New Articles From Microcontroller Tips

Back
Top