Continue to Site
Follow along with the video below to see how to install our site as a web app on your home screen.
Note: This feature may not be available in some browsers.
")
steveB said:I think MrAL may be right about the Im value. The text is still ambiguous, but what he describes makes more physical sense.
Thanks a lot, Steve, MrAl.
MrAl: Thank you for the detailed analysis. But the author had stated that the Im in both figures had equal magnitude.
Steve, your answer for 80° conduction angle is pretty close to the given one. Could you please give it a look to see where I went wrong with my approach? Thanks.
Regards
PG
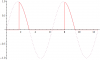
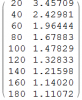
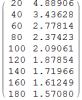
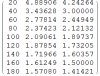
o knowing we got the right result for 180 degrees (and they did want us to use a rectangular wave for the estimation, not the true value of the RMS of a given wave) we compare fo computed with f0 from the Table and we find that they are simply NOT the same values.
Thus, i can see no way that the Table can be relied upon to be used when calculating the estimated RMS values using the procedure they outlined. It only takes one wrong value to screw up a table, and so i suggest that we try to find another table and ignore this one, or simply make our own table. We can vary the conduction angle from 20 degrees to 180 degrees as they did, and maybe Steve did that already.
Another point is that in today's world of programmable calculators and computers this method is probably deprecated anyway simply because it's not that hard to measure two or more points on the wave and then estimate based on the RMS values of the resulting triangular areas. We can then decide how much safety factor we want to include in the design rather than settle for some arbitrarily introduced value from a method that sometimes will come out overrated and sometimes come out underrated. You can make a table of both methods using say a sine wave and see the difference, then decide for yourself after comparing values that come from wide pulses and values that come from short pulses and see what the difference is.
Don't ask me which way is correct because the text is ambiguous in too many ways for my liking.
The table is in error by an amount which i consider too large to be a simple rounding or similar error for the day and age the book seems to have been written
I like the idea of the digital scope too, as long as their company can afford that kind of thing. Lucky today they are cheaper than they were when i worked in the industry.