I understand you can read this picture but I can't. Where did you answer the question about what program is this?
If you want help don't give out bad ratings.
View attachment 109920
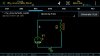
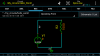
On LT Spice, and others, you can change "I(V1)" to "-I(V1).
OR
On other spices, you can change "I(V1) to I(R1). OR -I(R1) This way you are plotting the current in the resistor. OR negative current.
If I(R1) plots negative you can try removing the resistor and rotating 180 and putting it back.