Mr RB
Well-Known Member
...
One thing i was trying to show was that the dual pin output can work better than the single pin output, but i guess it doesnt matter that much depending on filtering. But the asc file i posted a while back was meant for anyone (such as yourself) that wanted to experiment with your pattern exactly as you posted it, and allow harmonic calculations before and after filter by simply using LT Spice. That means anyone who wants to work with this pattern can simply run LT and try various filters of almost any type, including passive or active. The file name of that file ends in 2b.asc if you are still interested.
...
I'm definitely appreciative, and interested in your dual pin designs. But I don't have a Spice program or any way to even view the principle or schematic of your .ASC model (unfortunately).
I did have a think about how to manually generate dual complimentary PWM and I think I already covered a technique on 8th Dec 2009 that would work on low-end PICs seen here; https://www.romanblack.com/onesec/ZE_SineInverter.htm
It can do any manual PWM of any number of pins, but takes a lot of time to write and test the code... Again it comes down to an effort: performance decision.
")
TheElectrician said:...
Mr RB, I've tracked down the source of the second harmonic. The way you have generated the PWM is the cause.
...
Doing this leads to a PWM wave which doesn't have half-wave symmetry; this then leads to some 2nd harmonic. I calculate the 2nd harmonic magnitude as about 3% of the fundamental.
...
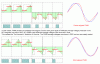
Hmm, ok thank you very much for finding this 2nd harmonic issue! I was completely unaware of it, or had forgotten, because I do remember reading something years ago on the benefits of centre-aligned PWM. So to put it in "simple terms" although each 20uS PWM cycle must have the correct average voltage, the force that pushes the sine UP is always at the start of the 20uS period and the force that pulls the sine down is always at the END of the 20uS period.
So there is a result that the sine always ramps UP (about) 10uS earlier than it should, and ramping DOWN occurs about (10uS) later than it should.
The worst case is actually less than 10uS it would be the time between the centres of the energy pulses. At 50% PWM it self cancels the 2nd harmonic time error , and at wave peaks the 2nd harmonic time error is quite low at 14% of 20uS or 2.8uS. The worst case is near the 45 degree positions where the PWM is about 70% so the time difference in the up and down energy is about 35% of 20uS or 7uS. These figures are all halved compared to a perfect sine as they are +/-.
So the total time distortion caused by the PWM will be an average of around 0uS to 7uS halved, or about +/- 2uS on a total sine period of 1000uS. I just don't see how that can be equated to a total error of 3%. The max error at any point can only be +/-3.5uS on 1000uS or 0.35% so the average must be less than that.
TheElectrician said:...
This means that in the later stages of your filter the 50 kHz will be essentially gone, but you will have almost the full amount of 2nd harmonic because your filter rolls off so slowly.
This means that you can't get less than about 3% distortion with your siimple filter. To do much better you would have to have a filter that can greatly attenuate the 2nd harmonic ...
...
Not entirely true! Even my crude filter (designed for max amplitude) attenuates 1kHz to 0.37 and 2kHz to 0.18 so that even if the 2kHz component was your stated 3% it would still be halved compared to the primary 1kHz.
And the more aggressive passive filters proposed by MrAl and yourself would result in a much greater reduction of the 2kHz component than my filter which was never designed to remove 2kHz!
TheElectrician said:...
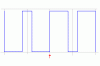
Rather than using this method: "For a given value N in the sine table, output a 1 for the N instruction cycles, then output a zero for 100-N instruction cycles."
you should do this: "For a given value N in the sine table, output a zero for (100-N)/2 cycyles, output a 1 for N cycles, then output another zero for (100-N)/2 cycles."
Yep that's completely understood. Some of the more expensive PICs (I believe) have provision to generate centre-aligned PWM. Also on many mid-range 18F series PICs the PWM polarity can be easily inverted, so the same sine half table could be used for both halves, but the PWM polarity reversed at the wave peak, so the UP and DOWN slopes of the sine would be time balanced. And there's always the option of complete manual PWM generation which is centre-aligned.
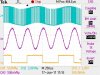
For now the main thing I think would be to quantify the 2nd harmonic problem caused by the PWM! I just don't buy the 3% total error figure. How many PWM cycles did you use in your simulation? Your charts show 25 cycles per sinewave?
As this is a time distortion error it will be directly related to the number of PWM cycles per sine, so it needs to be calculated with 50 PWM cycles per sine as used in my hardware. Also I have a feeling that since the smoothing effect of the 3-stage RC filter effects both amplitude AND time there will be quite a significant reduction in this time error by the end of the 3 stage filter.
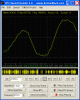
If you check Ericgibbs' simulation images he used actual PWM simulation and plotted the output of the filter vs a perfect sine, and there is practically no difference.
If someone has a simulator with the same feature can you provide the THD table for the OUTPUT of the filter? I think there has been way too much emphasis on analysing the source PWM error and not on analysing the actual error at the filter output.
...
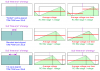
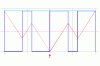
Below i've shown two pattern results, the first one being the original MrRB pattern and the second was just that same pattern only using just the first 25 pulses to create a 2 pin pattern (so the second half is the same but negative pulses instead of positive pulses). ...
I think that's a good idea that goes a long way to solving the 2nd harmonic issue.
Last edited:


")