Continue to Site

Welcome to our site!

Electro Tech is an online community (with over 170,000 members) who enjoy talking about and building electronic circuits, projects and gadgets. To participate you need to register. Registration is free. Click here to register now.

  • Welcome to our site! Electro Tech is an online community (with over 170,000 members) who enjoy talking about and building electronic circuits, projects and gadgets. To participate you need to register. Registration is free. Click here to register now.

Please help, precision 1kHz sine filter

Status
Not open for further replies.
Hello MRCecil,

What do you mean you are not getting the 51st harmonic with a 50kHz square wave? I dont think i said that you would :)
What i did say is that you would see the 49th and the 51st harmonic if you generate the pattern that MrRB was talking about. Using a pulsing carrier and sine wave is not the same thing as using an actual pulsing pattern that goes from 0 to 1 or from 0 to 1 and from -1 to 0 for the negative half cycle. It is possible to completely cancel the 50th harmonic even though the pattern has 50 switching periods in it. I was going to show this same behavior with another wave too which is much simpler to generate and analyze. If you like, i can post an asc file for you to look at that generates the simple pattern and you can see for yourself.

Obviously, I seem to be overlooking something very fundamental here based on your response. So yes, please send me the that asc file so I can ruminate over it.

Did you look over my post #38 and my findings? Is the middle thumb NOT the output of the PIC?
 
MrAl, That's an interesting idea but it would be pretty tight for the PIC manually generating the PWM as even with a 20MHz xtal there is only 100 PIC instructions to generate the dual PWMs and sequence the lookup tables and ensure perfect timing. It might be do-able but will run to the "very difficult" end of the spectrum and again that's a bit like adding external hardware, it heads away from the "easy and simple" design goals. :)

-----------------------
Ericgibbs, Thank you for the nice screenshot of the simulation in post #30! :) Without data tables etc it's immediately accessible to people of hobby level skills, they can see the practically perfect match of the blue PIC sinewave behind a perfect reference sinewave. With your permission I will include that screenshot on the webpage too.

I noticed you are getting a 3v p/p output after the filter, are you using a PWM sine from 0% to 100%? I deliberately made the PWM sine from 14% to 86% as it avoids distortion caused by very narrow PWM pulses as it maintains a minimum pulse width of 14% at all times.

-----------------------
Thank you MRCecil for posting the data. :) It's good to see how much of the 50kHz is still left after the filter, as I tuned the RC filter to "just" take out the 50kHz on the 'scope. That data is much appreciated.

There are some issues with your source waveform however! The main one is that it is not rail to rail PWM, instead you are 50% PWM 50kHz modulating a sine. The most obvious difference is that the average short term output voltage is half way between the wave and 0v giving you only half the output amplitude. So when your wave peaks at 3.6v the average voltage out is only 1.8v at that point.

Also the AD822 will not have the same ability to source and sink as the PIC PWM output which are a very low Rds FET pair. Seeing that I used quite a high load for the first stage (330ohm->0.33uF) the PIC could handle this but it will be causing significant distortion as the AD812 tries to drive enough current into that low impedance load! This is visible in the "ground" portion of your wave and will be worse (but not visible) in the upper portion of the wave as I'm sure the AD812 has less ability to source than it does to sink.

A necessity of the source PWM is that the PIC has very low ohms FETs and a regulated 5v rail, so the PWM average in any one 50kHz cycle will be quite an accurate DC average voltage. Ericgibb's simulation appears to use a "perfect" PWM source that pulls up to 4.9v and pulls down to 0.1v which is a very good approximation of what the PIC PWM pin actually does in this case.

However your simulation does provide good data on the harmonic content left from
the carrier, although I believe the real world total THD figure will be lower than your 0.082% result mainly because of the difference in the PIC vs AD812 ability to drive that very low impedance filter.

-----------------------
The Electrician said:
...
In post #15, you said: "Without filter:
THD=0.3 (up to 157th harmonic)"

I think the OP's pattern gives much higher THD than 0.3 (percent) even with harmonics only up to the 157th taken into account.
...

MrAl has worked hard to analyse the THD mathematically, and his base formula seems sound. Please comment if you think his procedure is flawed? I always assumed that his "0.3" was a reference to 30% distortion not 0.3% distortion. He used a % symbol everywhere else but that one initial value that may have been an estimation?
 
Last edited:
hi Roman,
This shows the PWM waveform used to produce the plot in #30.

Look at the BLUE plot, this is the reference sine, without any phase shift relative to the PWM. The GREEN plot is the Output, which of course is phase shifted.

I will try to match the 14% and 86% limits and do another plot, later on.
 

Attachments

  • RB_pwm1.gif
    RB_pwm1.gif
    42.8 KB · Views: 237
Last edited:
Hi again,

MRCecil:
Im not sure what you are referring to in your post 38. I did read that one and took note of the circuit and harmonics, so im not sure what you want me to look at there.
I am posting the pulsed output file i was talking about so you can take a look at the waves and the Fourier components. You'll note that i have three different sources in that file but only two of them (the two that are not the PWL pulses) allow Fourier analysis for some reason.

MrRB:
I would have thought that if the min pulse width was 14 instructions than a bit banging technique would work ok, but let me look at this a little later and get back to you again. I'm posting that file for the pulses you may want to take a look at too.

Eric:
How are you generating your pulses? I was going to do that with LT Spice but i found that the PWL source doesnt seem to allow Fourier analysis, or did i do something wrong there?
I got the other two sources in my file (attached) to work fine with Fourier however.
 
Hi again,

MRCecil:
Im not sure what you are referring to in your post 38. I did read that one and took note of the circuit and harmonics, so im not sure what you want me to look at there.
I am posting the pulsed output file i was talking about so you can take a look at the waves and the Fourier components. You'll note that i have three different sources in that file but only two of them (the two that are not the PWL pulses) allow Fourier analysis for some reason.

MrRB:
I would have thought that if the min pulse width was 14 instructions than a bit banging technique would work ok, but let me look at this a little later and get back to you again. I'm posting that file for the pulses you may want to take a look at too.

Eric:
How are you generating your pulses? I was going to do that with LT Spice but i found that the PWL source doesnt seem to allow Fourier analysis, or did i do something wrong there?
I got the other two sources in my file (below) to work fine with Fourier however.


Code:
Version 4
SHEET 1 888 680
WIRE 464 -96 320 -96
WIRE -944 -64 -1056 -64
WIRE 176 -64 -256 -64
WIRE 320 -32 320 -96
WIRE -256 16 -256 -64
WIRE -1056 32 -1056 -64
WIRE -256 128 -256 96
WIRE -1056 144 -1056 112
WIRE 320 144 320 48
WIRE -784 240 -880 240
WIRE -880 272 -880 240
WIRE 176 272 176 -64
WIRE 320 272 320 224
WIRE 320 272 176 272
WIRE -880 384 -880 352
FLAG -256 208 0
FLAG -360 328 0
FLAG 464 -96 Vo1
IOPIN 464 -96 Out
FLAG -1056 144 0
FLAG -880 464 0
SYMBOL voltage -256 112 R0
WINDOW 123 0 0 Left 0
WINDOW 39 0 0 Left 0
SYMATTR InstName V1
SYMATTR Value PULSE(0 1 0.1m 1e-6 1e-6 0.1m 1m 10)
SYMBOL voltage -256 0 R0
WINDOW 123 0 0 Left 0
WINDOW 39 0 0 Left 0
SYMATTR InstName V2
SYMATTR Value PULSE(0 1 0.3m 1e-6 1e-6 0.1m 1m 10)
SYMBOL voltage 320 128 R0
WINDOW 123 0 0 Left 0
WINDOW 39 0 0 Left 0
SYMATTR InstName V3
SYMATTR Value PULSE(0 -1 0.6m 1e-6 1e-6 0.1m 1m 10)
SYMBOL voltage 320 -48 R0
WINDOW 123 0 0 Left 0
WINDOW 39 0 0 Left 0
SYMATTR InstName V4
SYMATTR Value PULSE(0 -1 0.8m 1e-6 1e-6 0.1m 1m 10)
SYMBOL voltage -1056 16 R0
WINDOW 3 -319 -149 Left 0
WINDOW 123 0 0 Left 0
WINDOW 39 0 0 Left 0
SYMATTR InstName V5
SYMATTR Value PWL(0.1m 0 0.1001m 1 0.2m 1 0.2001m 0 0.3m 0 0.3001m 1 0.4m 1 0.4001m 0 0.6m 0 0.6001m -1 0.7m -1 0.7001m 0 0.8m 0 0.8001m -1 0.9m -1 0.9001m 0)
SYMBOL voltage -880 368 R0
WINDOW 123 0 0 Left 0
WINDOW 39 0 0 Left 0
SYMATTR InstName V6
SYMATTR Value PULSE(0 1 0.1m 1e-7 1e-7 0.1m 1m 10)
SYMBOL voltage -880 256 R0
WINDOW 123 0 0 Left 0
WINDOW 39 0 0 Left 0
SYMATTR InstName V7
SYMATTR Value PULSE(0 -1 0.6m 1e-7 1e-7 0.1m 1m 10)
TEXT -296 328 Left 0 !.tran 0 2m 0 1e-8
TEXT -296 400 Left 0 !.four 1kHz v(Vo1)
 
Last edited:
hi Roman.
This is the closest I can get to , ie 14% thru 86% PWM.
The On/Off's over a 20uS period is 2.8uS/17.2uS which I would consider OK.

I have limited the output voltage swing of the PIC [pwm4] from 0.2V thru 4.8V.
The plots show all the important traces.

Hi Al,
I am using a PWM model from the Yahoo user group, a little 'fiddly' at first but gives good results.
 

Attachments

  • RB_14_86a.gif
    RB_14_86a.gif
    67.3 KB · Views: 224
hi Al,
Attached is my complete PWM folder for this thread, unzip and place the folder in your Work folder.
RB's asc files are included

Eric
 

Attachments

  • Alpwm1.zip
    8.6 KB · Views: 221
Hi Roman,
The 2nd image , without the inductor, plus a rail to rail OPA
 

Attachments

  • RB_opa1.gif
    RB_opa1.gif
    45.4 KB · Views: 220
Hi again,

Eric:
Thanks very much for those files, very interesting. I am not sure which file you ran yet though, was it 14b? I see you are generating the pattern using PWM which im sure you know is not exactly what MrRB is doing so the harmonics in the pattern will be different right?

Everyone:
I am starting to see that we are not all on the same 'page' here :) I am doing it one way, someone else is doing it another way, and someone else is yet doing it another way, etc. We all had our own way of doing things and that turned out to result in differing outcomes. This is good in a way because we get to see different views on how this can be done, but maybe we should all start doing it the same way so that we can start to get similar results, and i dont exclude myself either because i had my own view of how to do it too which wasnt 100 percent exactly the way MrRB wanted to do it.
With this next asc file, i believe we can all start to do the exact pattern that MrRB proposed and analyze with various filters and such, and also look at the pattern harmonics and compare to other patterns that could offer improvement. The way i see it, if you are going to bother generating a pattern at all, might as well generate the best one you can come up with.
In any case, here is the file and you can run it in LT spice and check out the two responses Vo1 and Vo2 and of course view the Fourier components.
Please post any comments you might have about this file or the results, etc.

This pattern should be exact (no cheating he he) except the rise and fall times are 1e-7 which should probably be shorter than that, like 1e-8 or something, but we can fix that easily if you want to see the difference in LT spice.

Oh yeah, note that this isnt the simplest way to generate MrRB's pattern, but it does in fact work so what the heck :)
 

Attachments

  • PulsePatternMrRB-02b.asc
    9.6 KB · Views: 231
hi Roman, Al
I am opting out posting to this thread, I hope you get a successful solution.:)

Eric
 
hi Roman, Al
I am opting out posting to this thread, I hope you get a successful solution.:)

Eric


Hi Eric,

What happened did you loose interest or something like that? Do you still find these patterns interesting? Yeah, it's a little more work then we usually run into around here but it's also a little more interesting i think.

I was fooling around with the pattern a bit and using a 2 pin pattern works pretty nice. Using the same filter as before (just a 2k and 0.1uf cap) the results look like this (attachment). Note the wide voltage swing possible with a 2 pin bridge type output pattern.
 

Attachments

  • PulsePattern-Mine-01.gif
    PulsePattern-Mine-01.gif
    27.8 KB · Views: 217
Last edited:
I generated the PWM waveform with a function generator and measured the distortion with a distortion analyzer (it uses the first definition of distortion from post #22). The analyzer only sees harmonics up to a little over 100 kHz, so I reduced the frequency of the PWM waveform to 100 Hz instead of 1000Hz. This won't change the distortion.

Attached are two images showing the scope capture of the residual from the analyzer and a photo of the analyzer's meter. The residual shows some gaps in the very narrow parts of the waveform, but this is due to an artifact of the digital scope; upping the sweep speed shows that the waveform is ok. The residual is just what is expected.

The scale of the analyzer reading is 100% full scale. The reading is about 89% which compares favorably with my calculation of 86.6%

I constructed a 3 stage filter like the one in post #16, but without the inductor. I increased the function generator's frequency back up to 1 kHz and measured the distortion at the outputs of the 3 stages of the filter.

At the output of the first stage, the distortion is 4.2%.

The distortion at the later stages is too high due to a strong 2nd harmonic component in the residual. Since we know that there shouldn't be any 2nd harmonic component, this must be due to a defect in the function generator's output. I suspect it's due to the limited and probably unsymmetrical rise and fall times in the PWM waveform.

I may try to make the measurements at 100 Hz but this will require modifying the filter stages for the lower frequency.
 

Attachments

  • PWM_Dist_Unfilt.jpg
    PWM_Dist_Unfilt.jpg
    168.7 KB · Views: 248
  • PWM_Residual.jpg
    PWM_Residual.jpg
    23.1 KB · Views: 221
Hello there Electrician,

Oh that's very nice, perhaps you can verify some of this other stuff at some point.

You'll notice that there is some 2nd harmonic content in the original pulse pattern posted by MrRB. It's quite high actually, around 2.3 percent. So perhaps the measurement was more accurate than originally thought.

If you scroll back a few posts you'll see an .asc file that i posted that generates the exact pattern MrRB posted and so we can look at this in LT Spice. I used rise and fall times of 1e-7 but i can go lower too (see second set of results that use rise and fall times of 1e-9).
Here are the results of the raw pattern up to the 55th harmonic (second set follows):

Code:
Harmonic    Frequency     Fourier     Normalized     Phase      Normalized
 Number       [Hz]       Component     Component    [degree]    Phase [deg]
    1       1.000e+03    1.797e+00    1.000e+00       -3.65°        0.00°
    2       2.000e+03    4.054e-02    2.256e-02      172.69°      176.35°
    3       3.000e+03    2.236e-03    1.244e-03      -10.96°       -7.31°
    4       4.000e+03    5.588e-04    3.109e-04      165.39°      169.04°
    5       5.000e+03    4.619e-03    2.570e-03      161.73°      165.38°
    6       6.000e+03    9.522e-04    5.298e-04      -21.92°      -18.27°
    7       7.000e+03    2.302e-03    1.281e-03      -25.58°      -21.93°
    8       8.000e+03    1.452e-03    8.081e-04      -29.23°      -25.58°
    9       9.000e+03    1.018e-02    5.662e-03      -32.89°      -29.23°
   10       1.000e+04    5.265e-04    2.930e-04      143.47°      147.12°
   11       1.100e+04    7.965e-03    4.432e-03      -40.19°      -36.54°
   12       1.200e+04    5.421e-04    3.017e-04      136.16°      139.81°
   13       1.300e+04    5.589e-03    3.110e-03      -47.50°      -43.85°
   14       1.400e+04    4.109e-03    2.286e-03      128.85°      132.50°
   15       1.500e+04    5.844e-03    3.252e-03      125.19°      128.84°
   16       1.600e+04    6.053e-03    3.368e-03      -58.46°      -54.81°
   17       1.700e+04    8.542e-03    4.753e-03      -62.12°      -58.46°
   18       1.800e+04    2.844e-03    1.583e-03      114.23°      117.88°
   19       1.900e+04    2.644e-03    1.471e-03      -69.42°      -65.77°
   20       2.000e+04    3.388e-03    1.885e-03      106.92°      110.57°
   21       2.100e+04    3.332e-03    1.854e-03      103.27°      106.92°
   22       2.200e+04    4.529e-03    2.520e-03      -80.39°      -76.73°
   23       2.300e+04    3.215e-03    1.789e-03      -84.04°      -80.39°
   24       2.400e+04    2.437e-03    1.356e-03       92.31°       95.96°
   25       2.500e+04    1.261e-07    7.019e-08       95.98°       99.64°
   26       2.600e+04    2.570e-03    1.430e-03       85.00°       88.65°
   27       2.700e+04    2.543e-03    1.415e-03       81.34°       84.99°
   28       2.800e+04    5.260e-03    2.927e-03     -102.31°      -98.66°
   29       2.900e+04    1.711e-03    9.522e-04     -105.96°     -102.30°
   30       3.000e+04    4.567e-03    2.541e-03       70.38°       74.04°
   31       3.100e+04    2.514e-03    1.399e-03       66.72°       70.38°
   32       3.200e+04    4.105e-03    2.284e-03       63.07°       66.73°
   33       3.300e+04    4.230e-03    2.354e-03       59.42°       63.07°
   34       3.400e+04    9.861e-03    5.487e-03     -124.24°     -120.58°
   35       3.500e+04    7.624e-04    4.242e-04       52.15°       55.81°
   36       3.600e+04    7.676e-03    4.271e-03       48.45°       52.11°
   37       3.700e+04    2.968e-03    1.652e-03       44.80°       48.46°
   38       3.800e+04    2.619e-03    1.457e-03       41.15°       44.80°
   39       3.900e+04    7.659e-03    4.262e-03       37.49°       41.15°
   40       4.000e+04    1.044e-03    5.807e-04       33.85°       37.50°
   41       4.100e+04    6.518e-03    3.627e-03       30.19°       33.84°
   42       4.200e+04    6.164e-03    3.430e-03     -153.47°     -149.81°
   43       4.300e+04    3.027e-03    1.684e-03       22.88°       26.53°
   44       4.400e+04    3.208e-03    1.785e-03     -160.78°     -157.13°
   45       4.500e+04    1.405e-02    7.818e-03       15.57°       19.22°
   46       4.600e+04    7.018e-02    3.905e-02       11.92°       15.57°
   47       4.700e+04    2.511e-01    1.397e-01        8.26°       11.92°
   48       4.800e+04    6.447e-01    3.587e-01        4.61°        8.26°
   49       4.900e+04    8.996e-01    5.006e-01        0.95°        4.61°
   50       5.000e+04    1.715e+00    9.544e-01       -1.03°        2.62°
   51       5.100e+04    8.412e-01    4.680e-01      173.65°      177.30°
   52       5.200e+04    6.470e-01    3.600e-01      -10.01°       -6.35°
   53       5.300e+04    2.941e-01    1.636e-01      166.34°      169.99°
   54       5.400e+04    1.023e-01    5.693e-02      -17.32°      -13.66°
   55       5.500e+04    2.990e-02    1.664e-02      159.03°      162.68°
Total Harmonic Distortion: 130.035648%
Here are the results with rise and fall times 1e-9:

Code:
Fourier components of V(vo1)
DC component:2.50025

Harmonic    Frequency     Fourier     Normalized     Phase      Normalized
 Number       [Hz]       Component     Component    [degree]    Phase [deg]
    1       1.000e+03    1.797e+00    1.000e+00       -3.60°        0.00°
    2       2.000e+03    4.054e-02    2.256e-02      172.80°      176.40°
    3       3.000e+03    2.236e-03    1.244e-03      -10.80°       -7.20°
    4       4.000e+03    5.588e-04    3.109e-04      165.60°      169.20°
    5       5.000e+03    4.619e-03    2.570e-03      162.00°      165.60°
    6       6.000e+03    9.522e-04    5.298e-04      -21.60°      -18.00°
    7       7.000e+03    2.302e-03    1.281e-03      -25.20°      -21.60°
    8       8.000e+03    1.452e-03    8.081e-04      -28.80°      -25.20°
    9       9.000e+03    1.018e-02    5.662e-03      -32.40°      -28.80°
   10       1.000e+04    5.265e-04    2.930e-04      144.00°      147.60°
   11       1.100e+04    7.965e-03    4.432e-03      -39.61°      -36.01°
   12       1.200e+04    5.421e-04    3.016e-04      136.79°      140.39°
   13       1.300e+04    5.589e-03    3.110e-03      -46.81°      -43.21°
   14       1.400e+04    4.109e-03    2.286e-03      129.59°      133.19°
   15       1.500e+04    5.844e-03    3.252e-03      125.99°      129.59°
   16       1.600e+04    6.054e-03    3.368e-03      -57.61°      -54.01°
   17       1.700e+04    8.542e-03    4.753e-03      -61.21°      -57.61°
   18       1.800e+04    2.844e-03    1.583e-03      115.19°      118.79°
   19       1.900e+04    2.644e-03    1.471e-03      -68.41°      -64.81°
   20       2.000e+04    3.388e-03    1.885e-03      107.99°      111.59°
   21       2.100e+04    3.333e-03    1.854e-03      104.39°      107.99°
   22       2.200e+04    4.529e-03    2.520e-03      -79.21°      -75.61°
   23       2.300e+04    3.215e-03    1.789e-03      -82.82°      -79.21°
   24       2.400e+04    2.438e-03    1.356e-03       93.59°       97.19°
   25       2.500e+04    1.577e-07    8.774e-08      110.95°      114.55°
   26       2.600e+04    2.570e-03    1.430e-03       86.39°       89.99°
   27       2.700e+04    2.543e-03    1.415e-03       82.78°       86.38°
   28       2.800e+04    5.259e-03    2.926e-03     -100.82°      -97.21°
   29       2.900e+04    1.711e-03    9.521e-04     -104.42°     -100.82°
   30       3.000e+04    4.567e-03    2.541e-03       71.98°       75.58°
   31       3.100e+04    2.514e-03    1.399e-03       68.38°       71.98°
   32       3.200e+04    4.105e-03    2.284e-03       64.78°       68.38°
   33       3.300e+04    4.230e-03    2.354e-03       61.18°       64.78°
   34       3.400e+04    9.861e-03    5.487e-03     -122.42°     -118.82°
   35       3.500e+04    7.631e-04    4.246e-04       53.98°       57.58°
   36       3.600e+04    7.676e-03    4.271e-03       50.38°       53.98°
   37       3.700e+04    2.967e-03    1.651e-03       46.78°       50.38°
   38       3.800e+04    2.618e-03    1.457e-03       43.18°       46.78°
   39       3.900e+04    7.658e-03    4.261e-03       39.58°       43.18°
   40       4.000e+04    1.043e-03    5.803e-04       35.98°       39.58°
   41       4.100e+04    6.518e-03    3.627e-03       32.38°       35.98°
   42       4.200e+04    6.166e-03    3.431e-03     -151.22°     -147.62°
   43       4.300e+04    3.027e-03    1.684e-03       25.17°       28.77°
   44       4.400e+04    3.210e-03    1.786e-03     -158.43°     -154.83°
   45       4.500e+04    1.405e-02    7.818e-03       17.98°       21.58°
   46       4.600e+04    7.018e-02    3.905e-02       14.38°       17.98°
   47       4.700e+04    2.511e-01    1.397e-01       10.77°       14.38°
   48       4.800e+04    6.447e-01    3.588e-01        7.17°       10.77°
   49       4.900e+04    8.996e-01    5.006e-01        3.57°        7.17°
   50       5.000e+04    1.715e+00    9.545e-01       -0.01°        3.59°
   51       5.100e+04    8.412e-01    4.681e-01      176.37°      179.97°
   52       5.200e+04    6.470e-01    3.600e-01       -7.23°       -3.63°
   53       5.300e+04    2.941e-01    1.636e-01      169.17°      172.77°
   54       5.400e+04    1.023e-01    5.693e-02      -14.43°      -10.83°
   55       5.500e+04    2.990e-02    1.664e-02      161.97°      165.57°
Total Harmonic Distortion: 130.043779%
As we can see from above there isnt too much difference between rise and fall times of 100ns and 1ns. When we get up higher in frequency though we would see a difference as the higher frequency components would be less with slower rise and fall times (less HF energy in a ramp than a perfectly square rise and fall).
 
Last edited:
I notice that you have edited your post. I think you have deleted a calculation of the THD, haven't you?

In the interests of convenient comparison with measurements, it would be good to calculate THD with total RMS value of the waveform in the denominator rather than the RMS value of the fundamental. As I mentioned in an earlier post, both methods are used, but as it happens, my distortion analyzer uses the audio method--total RMS in the denominator.

It's lunch time here on the U. S. west coast, but I'll be able to devote some more time to this in a few hours.
 
Last edited:
Hi again,

Deleted what? I did post the wrong result for the 2nd harmonic though, it was 2.3 percent not 0.23 percent :)
The way LT Spice does it is with the fundamental in the denominator, but i could switch my own program to reflect the other way too.
I've also read that the audio technique is with the fundamental in the denominator, and i think that is because we dont care what the other harmonics are adding to the total result usually except how they distort a nice clean wave.
 
Last edited:
Wow I'm floored by the amount of effort people have put into this, running the simulations and crunching the numbers etc, even down to the hardware sim by TheElectrician! Thank you very much to everyone for your help. :)

When I asked in post #1 for help in the filter design I was worried that I might make a bad filter booboo that would result in corruption of the original sine etc, but after all the work we have put in it's looking more and more like the PWM sine is pretty good at source and basically it only gets better as more aggressive filtering is added.

It would have been nice to be able to say; "With the sine table and filter values as chosen the final THD is 0.xxx%" but I did not realise the amount of work it was going to be or the time that people would be spending on it! This has gone past the "Please help me" of my original post and I'm getting ready now to put the project to bed and finish the writing of the open source web page.

Of course if MrAl and TheElectrician want to keep crunching the numbers then that's ok but I feel bad about the amount of work people are doing, and the possibility the thread will turn into nitpicking over minutae that the target audience of the project (PIC hobbyists) will never appreciate.

My design goal was to see if a simple PIC and internal math sine table could be doing the hard work, then apply a simple junkbox passive filter and get something that can be used as a piece of decent test equipment. At this point I that it's close enough to a success that I can put my original work and everybody's additions on the web page and start winding it up. And if there are more additions after that (like exploration of a 2pin complimentary PWM) then it can be added easily enough at any later date. :D
 
Hi MrRB,

I've always found these patterns to be interesting and came up with various formulas as far back as in the early 1980's, so for me it's both a refresher and a recoup of some of that interest. Back then i worked with this kind of technology on a regular basis on projects that went up to 30 thousand watts three phase, and other lower powered ones that worked with million dollar solar arrays.

One thing i was trying to show was that the dual pin output can work better than the single pin output, but i guess it doesnt matter that much depending on filtering. But the asc file i posted a while back was meant for anyone (such as yourself) that wanted to experiment with your pattern exactly as you posted it, and allow harmonic calculations before and after filter by simply using LT Spice. That means anyone who wants to work with this pattern can simply run LT and try various filters of almost any type, including passive or active. The file name of that file ends in 2b.asc if you are still interested. The pulse pattern is made up of multiple sources, each source provides a single pulse and the combination makes up the entire pulse pattern. You can change it if you like by changing the pulse times, but it does require a lot of manual input to modify. As is though, it's your original pattern. What this means is that anyone who wants to do the calculations can do them as long as they know how to run the LT Spice IV simulator.
 
Last edited:
Hi again,

Deleted what? I did post the wrong result for the 2nd harmonic though, it was 23 percent not 0.23 percent :)

If I read your results right, with a normalized fundamental of 1.00 and a normalized second harmonic of 2.256e-02, isn't that about 2.256%, not 23%?

Mr RB, I've tracked down the source of the second harmonic. The way you have generated the PWM is the cause.

As MrAL described:

"For the first pulse which is 50, you generate a '1' output for 50 instruction cycles, then output a '0' for 50 more instr cycles, then
for the second pulse which is 55 you output a '1' for 55 instr cycles, then output a '0' for 45 more instr cycles, then
for the third pulse which is 59 you output a '1' for 59 instr cycles, then output a '0' for 41 more instr cycles, then
etc., etc.,
until you get to the last and then repeat.
So in general you output a '1' for the table entry and then a '0' for 100 minus the table entry.
"

Doing this leads to a PWM wave which doesn't have half-wave symmetry; this then leads to some 2nd harmonic. I calculate the 2nd harmonic magnitude as about 3% of the fundamental. This means that in the later stages of your filter the 50 kHz will be essentially gone, but you will have almost the full amount of 2nd harmonic because your filter rolls off so slowly.

This means that you can't get less than about 3% distortion with your siimple filter. To do much better you would have to have a filter that can greatly attenuate the 2nd harmonic while not significantly attenuating the fundamental. That would be a much sharper cutoff filter than you can implement with R/C stages.

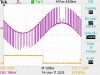
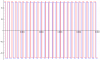
I've attached a couple of images that show the problem. In these images I've shown the first 1/2 millisecond of the PWM waveform overlaid on the second 1/2 millisecond of the waveform, and I've offset the two waveforms vertically a little bit for clarity. I've also removed the DC component of the waveform and made the peak-to-peak amplitude equal to 1.

In the first image, you can see the first half of the PWM waveform in blue and the second half in red. The left edge of each transition is the beginning of an interval. You can see that in the top of the image, the narrow red positive periods are not centered in the wide blue intervals; they are aligned with the left side of the wide blue intervals. In the bottom of the image, the narrow blue periods are not aligned with the left of the wide red intervals; they are aligned to the right. This is the problem.

Rather than using this method: "For a given value N in the sine table, output a 1 for the N instruction cycles, then output a zero for 100-N instruction cycles."

you should do this: "For a given value N in the sine table, output a zero for (100-N)/2 cycyles, output a 1 for N cycles, then output another zero for (100-N)/2 cycles."

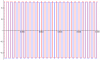
The second image again shows a comparison of the first and second half of the PWM waveform generated with this method. Notice how the narrow pulses are centered in the wide pulses. When I calculate the 2nd harmonic of this waveform, it is essentially zero, so after filtering you would be able to get a distortion of well under 1%, I think.

I'm aware that there are problems with this solution to the 2nd harmonic problem, such as, for example, some of the values in the sine table are not evenly divisible by 2, and the PIC may not be fast enough to do all this, etc. But, to get distortion under 3%, you will have to come up with a PWM waveform that has half-wave symmetry by some method, if your filtering is going to be simple R/C stages.
 

Attachments

  • PWM_with2nd.png
    PWM_with2nd.png
    6.1 KB · Views: 222
  • PWM_no2nd.png
    PWM_no2nd.png
    6 KB · Views: 219
If I read your results right, with a normalized fundamental of 1.00 and a normalized second harmonic of 2.256e-02, isn't that about 2.256%, not 23%?


Hello again Electrician,

I have to laugh at myself a little here as the value in the table is clearly 0.02256 and yet first i quoted "23 percent", then later quoted "0.23 percent" <chuckle>. Obviously it is really "2.3 percent" as you noted, so thanks for pointing that out. Also as you noted, it's higher than we should have for the base raw pattern, and i was trying to convince MrRB to search for another pattern but he hasnt said too much about this yet. I suggested a 2 pin pattern because that has some advantages, the first one being that we automatically get a 3 level output pattern rather than just a 2 level output pattern like the original pattern MrRB described. We use the same number of pulses but we get an extra 'free' AD level that help lower the distortion somewhat.
The nice thing about some of these patterns is that we can take out the even harmonics without doing much work. Below i've shown two pattern results, the first one being the original MrRB pattern and the second was just that same pattern only using just the first 25 pulses to create a 2 pin pattern (so the second half is the same but negative pulses instead of positive pulses). The nice thing about it is that ALL of the even harmonics are eliminated. Yes it's a little high in 3rd harmonic which means it would need a little more work, but i think the main point is clear.

Here are the two pattern results for comparison:

Code:
Relative harmonic content (two level pattern):
  1: +1.00000
  2: +0.02256     3: +0.00124     4: +0.00031     5: +0.00257
  6: +0.00053     7: +0.00128     8: +0.00081     9: +0.00566
 10: +0.00029    11: +0.00443    12: +0.00030    13: +0.00311
 14: +0.00229    15: +0.00325    16: +0.00337    17: +0.00475
 18: +0.00158    19: +0.00147    20: +0.00189    21: +0.00185


Relative harmonic content (three level pattern):
  1: +1.00000
  2: +0.00000     3: +0.01145     4: +0.00000     5: +0.00417
  6: +0.00000     7: +0.00183     8: +0.00000     9: +0.00567
 10: +0.00000    11: +0.00443    12: +0.00000    13: +0.00316
 14: +0.00000    15: +0.00469    16: +0.00000    17: +0.00548
 18: +0.00000    19: +0.00148    20: +0.00000    21: +0.00322
 
Hi again,


For comparison to the two pattern results i posted above, here is a 2 pin pattern that was generated with a little more attention to detail. The Fourier amplitude and phase component is made up out of the vector components An and Bn, and of course in general these are present for all harmonics 1 through N. Certain techniques as Electrician noted allow the removal of some harmonics. Other techniques allow the removal of all the even harmonics, and still another technique allows the removal of all the An (except maybe for A0) leaving only the Bn. This, as well as some other little tricks, leads to a pattern with fairly low odd harmonic levels near the fundamental that come only from the Bn, and of course also eliminate all of the even harmonics. This results in a fairly low distortion pattern when the more easily filtered higher harmonics are filtered out even with passive filtering.
As an example, here are the harmonic content results of just such a pattern up to the 56th harmonic:
Code:
Relative harmonic content:
  1: +1.00000
  2: +0.00000     3: +0.00303     4: +0.00000     5: +0.00237
  6: +0.00000     7: +0.00169     8: +0.00000     9: +0.00195
 10: +0.00000    11: +0.00013    12: +0.00000    13: +0.00185
 14: +0.00000    15: +0.00258    16: +0.00000    17: +0.00168
 18: +0.00000    19: +0.00508    20: +0.00000    21: +0.00196
 22: +0.00000    23: +0.00161    24: +0.00000    25: +0.00121
 26: +0.00000    27: +0.00124    28: +0.00000    29: +0.00145
 30: +0.00000    31: +0.00333    32: +0.00000    33: +0.00205
 34: +0.00000    35: +0.00065    36: +0.00000    37: +0.00434
 38: +0.00000    39: +0.00206    40: +0.00000    41: +0.00038
 42: +0.00000    43: +0.00153    44: +0.00000    45: +0.00215
 46: +0.00000    47: +0.01399    48: +0.00000    49: +0.19108
 50: +0.00000    51: +0.26890    52: +0.00000    53: +0.22955
 54: +0.00000    55: +0.21021    56: +0.00000
Note all of the even harmonics are gone, and there are no An components so these are obtained directly from the Bn.
Also note the lower harmonics like the 3rd, 5th, and 7th, which are harder to filter out are much reduced. Integer truncation probably will not allow much more reduction however, but since this pattern was generated rather casually there might still be room for improvement.
 
Last edited:
Status
Not open for further replies.

Latest threads

New Articles From Microcontroller Tips

Back
Top