Continue to Site

Welcome to our site!

Electro Tech is an online community (with over 170,000 members) who enjoy talking about and building electronic circuits, projects and gadgets. To participate you need to register. Registration is free. Click here to register now.

  • Welcome to our site! Electro Tech is an online community (with over 170,000 members) who enjoy talking about and building electronic circuits, projects and gadgets. To participate you need to register. Registration is free. Click here to register now.

Phase Shift

Status
Not open for further replies.
Q: Calalate the Phase Diff between A and B Signals.
my ans is θ= t/T*360 =2/3*360=240 deg
this what i have learned???
 

Attachments

  • IMG.pdf
    405.8 KB · Views: 274
Explain how you get the figures '2' and '3'.
 
Hello there,

I think you got the 2/3 from the fact that one signal goes through zero 2/3 of the way from a minor division? Just a guess, but if so you're on the right track. Only thing is, one division is not 360 degrees and there is also another full division between that signal and the other signal.

First figure out what one minor division (horizontal) is, then go from there, and remember to add any other minor divisions if necessary to get the total phase shift.
 
Hello again,


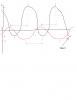
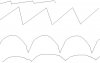
If you look at the larger amplitude wave during the first half cycle it spans approximately 4 minor divisions (actually a tiny bit less than that but we'll call it that for now and you'll have to adjust yourself later). Since a half cycle is 180 degrees that means 2 minor divisions (half of that) is 90 degrees, and so 1 minor division is equivalent to 45 degrees.

Now looking at the last half cycle of the bigger wave, at the time it rises through zero (the leading edge) it is approximately 2/3 of one minor division past one major division, and since one minor is 45 degrees that means it (is 2/3)*45=30 degrees past the second to last major division. Looking at the smaller wave near the same major division, its rising edge going through zero is approximately one full minor division before the second to last major division, so that means is is 45 degrees before that major division. Since the smaller wave is 45 degrees before and the larger wave is 30 degrees after we add the two and get a total of 75 degrees phase shift.

The simplest way to find the phase shift from a graph is to look at the zero crossings where the waves are rising.

Keep in mind that the above calculation of 75 degrees was assuming the larger wave half cycle took up EXACTLY 4 minor divisions. If you look more closely you'll see that it is slightly less than that (note the second wave falling edge doesnt cross zero directly at a minor division and the third is even farther away than the second) so it's up to you to find a more accurate answer. For a hint, i would say the third wave falling edge goes through zero about half way before that last major division. I think it would be ok to approximate like this because the graph isnt that perfect, having some minor divisions that are a little wider than others. On the other hand approximating 180 degrees equals one half cycle may not be acceptable for the final result because it is clear from the larger wave that it looks perfectly synced with the minor divisions to start but toward the end it is not synced, indicating a difference that although not huge is still definitely noticeable.
It should also be noted that the leading edge of the larger wave is not 'exactly' 2/3 of the way past that second to last major division (at 6us), but a little less than that.

I might add that another way to do this is to convert everything to time and then measure the time between zero crossings and then convert back to degrees.

Given the above, lets see if you can come up with a good estimate for the phase shift now. A hint is the phase shift is between 60 and 90 degrees.

[As a final quick note, in real life we might be able to adjust the horizontal time scale to uncalibrated so we can adjust it until one full cycle spans exactly 8 minor divisions and then estimate the phase shift in a similar manner to the above]
 
Last edited:
Hi
I Understand what you say 1Cycle =360DeG. Sig2 crosses @270
This means that Phase Shift =2.4-0.8/3.2*270=135 Deg
Thanks.
I have a similaiar problem with a solution from a previous assignment .Can we pls dicuss it.

Note: Im studying this module through distance learning.
Im not in the Electronic Industry.
The biggest problem i have is that i dont get hold of Lectures but Im still eager learn via extra resources.My Text book does not have all the Info I need .that is why I really Appreciate it if Some one can help or assist like u.
Thanks.
 

Attachments

  • Assignment2009.pdf
    646.5 KB · Views: 271
Last edited:
Hi again,


In the first exercise the phase shift is close to 75 degrees. Usually we choose the two rising edges that are closest to each other (as they go through zero) and then tag on 'leading' or 'lagging'. If you want to say it is close to 270 degrees you may get away with it, but not 135 degrees. If you still dont get this i'll post a more detailed explanation.

Your second graph has a phase shift of 120 degrees (note we take the two rising edges that are closest to each other again). See the attached diagram to see why this is so. Signal 2 has a DC offset so you have to compensate for that first by zeroing it out. Note that the 'old' signal 2 is a dashed line, while the 'new' signal 2 after shifting is a solid line.
I actually estimated it to be around 115 degrees with a quick visual, but 120 might be closer.
 

Attachments

  • PHASE03.gif
    PHASE03.gif
    265.1 KB · Views: 256
Last edited:
since both signals are symetrical, we can use points where they cross zero.
otherwise it would be better to use peak or some other feature.

using zero crossing it can be seen that the phases are 0.6uS appart while period is 2.8uS

360deg * 0.6/2.8 = 77.143deg
since the readings are taken of the graph it is acceptable to round the answer.
anything in range 75 to 80deg should be fine.
 
suppose your signals have DC bias, then you get graph where zero crossing is generally not acceptable (maybe DC bias is larger than signal, hence there is no zedro crossing at all).

fortunately signal amplitude and dc bas are irrelevant when evaluating phase shift.

in that case you need to pick some other feature of the signal you can reconize.
peaks are easy to spot (either min or max), so you can use them as ref. when determining phase shift.
 

Attachments

  • phase_diff.png
    phase_diff.png
    10.9 KB · Views: 241
Hello again,


A more general method is to use the zero crossing, and if there is any DC offset to remove it first and then look at the zero crossings. On a scope, we would adjust one or both waves vertical positions.

Refer to the attached drawings, Figure 1 and Figure 2.

In Figure 1, we see two waves, the blue wave goes through zero but the red wave doesnt yet we want to know the phase shift.

In Figure 2, we removed the DC offset from the red wave so it now crosses through zero. The phase difference is now easy to see.

Note we cant always use the peaks to get the phase shift, but we can always use the zero crossings.
 

Attachments

  • Fig1.gif
    Fig1.gif
    8.4 KB · Views: 246
  • Fig2.gif
    Fig2.gif
    8.5 KB · Views: 241
Last edited:
the question was about interpreting graph from piece of paper while writing exam.
he will not have scope in front of him so he will not be able to change displayed image by toggling AC/DC coupling.
 
Hi,

Yeah, so?

Graphically we would draw a horizontal line across the page where the zero crossing looks to be in the second wave or perhaps the first wave too. We then could draw a vertical line down from the first wave zero cross through the second wave. We could then compare phases.

Ultimately the student eventually uses a scope and this is probably a preparation exercise for that anyway.
 
Last edited:
not sure i agree. if signal does not have steep slopes, what looks like zero crossing may introduce significant error (for example things that resemble sine wave). imho, it is safer bet to lock on feature that is easily recognisable or well defined.
 
an example could be any number of simple forms like shown here. to find 'zero' on saw tooth, one could simply split slope line between peaks. but doing same for rectified sine wave would require integrating etc. doing it off 'zero crossing' from the graph would be way too complicated and inacurate. it is much simple to pick cusp (here on the bottom of the signal).
 

Attachments

  • phase_2.jpg
    phase_2.jpg
    20.3 KB · Views: 241
Hello again,


Yes sometimes it is easier to go by the peaks, but you still have to be careful. I could easily draw several wave shapes where you simply can not use the peaks or valleys. Some complex wave shapes will have their phase orientation defined elsewhere anyway, so you'll have to get used to find that spot and drawing a horizontal and/or vertical line through it.
A full wave rectified sine has it's phase defined by the generating sine in most cases.
 
Last edited:
Status
Not open for further replies.

Latest threads

New Articles From Microcontroller Tips

Back
Top