Continue to Site

Welcome to our site!

Electro Tech is an online community (with over 170,000 members) who enjoy talking about and building electronic circuits, projects and gadgets. To participate you need to register. Registration is free. Click here to register now.

  • Welcome to our site! Electro Tech is an online community (with over 170,000 members) who enjoy talking about and building electronic circuits, projects and gadgets. To participate you need to register. Registration is free. Click here to register now.

Need help connecting a spectrum analyzer to a breadboard

Status
Not open for further replies.
let say i give input signal of 1V pk-pk from frequency generator then i have to sweep the frequency everytime i want to see the response at all frequency?
 
Last edited:
let say i give input signal of 1V pk-pk from frequency generator then i have to sweep the frequency everytime i want to see the response at all frequency?

I am assuming you are using a simple one pole resistor/capacitor filter, [ not terminated, except for the high impedance scope connection and the signal generator set on the 50R output]
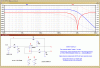
You still have not posted a simple diagram of you LPF.

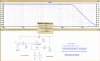
If you have designed the LPF correctly for a cut off frequency of 1MHz, its just a matter of determining the Bode plot.

Connect the scope Y1 channel to the input of the filter, connect the Y2 channel to the output of the filter.

Set the Y1 and Y2 to the same sensitivity, say 0.1V/division.

Starting at 500K [ sine wave input] the output should be the same amplitude as the input.
Slowly increase the frequency of the generator [ ensure that the Y1 is kept at the original amplitude] , as the frequency increases the output amplitude will start to fall.
When the output is 50% of the input, thats the -6dB point on the plot.

As you increase the freq, when the out is 33% of the input thats the-10dB point,, when its 10% thats the -20dB point.

As a check, reduce the frequency until the output is 70%, thats the -3dB point.

Now plot your recorded Freq and dB values on log/log graph paper.

Once plotted you should see that output falls at about -20db/decade, ie: slope

Do you follow that OK.?
 
Last edited:
**broken link removed**

**broken link removed**

this the diagram of lowpass filter. This lowpass filter has a cutoff of almost 300kHz.

I am doing exactly wht you said but am not getting the result. i have simulated the circuit on PSPICE software

hi,
I dont see a diagram.
I will try it in LTspice.
 
hi,
I have now copied your circuits, I will look and reply later.:)
 
ok thanx a lot .

I have run into a problem trying to use the AD844 model in LTS, I will try once more.

Who designed that filter.???

EDIT:
Downloaded LTspice model for the AD844A, using your values this what I get.

I would say your filter values are incorrect for a 1MHz point.

EDIT2:
Option2, later version shows the notch at 1MHz.
 

Attachments

  • AAesp02.gif
    AAesp02.gif
    44.8 KB · Views: 312
  • AAesp04.gif
    AAesp04.gif
    49.2 KB · Views: 303
Last edited:
hi

I designed this filter my own self. It has a cutoff frequency 300KHz. i have made changes in this circuit and got cutoff at 300KHz. i sent you the simulated response of PSPICE with cutoff at 300KHz. but how to see this response on oscilloscope is the main problem. because on oscilloscope m not getting thecutoff at 300KHz. What do I have to do now?

Look at my second image in my last post, its set for about 1MHz, use the new component values and pin 6.

Use pin 6 of the AD844 to measure the output using the scope, not the TZ on pin 5.
 
Last edited:
hi

I want the output from pin 2 (required ). Why u are taking output from pin 6. Any reason for taking output from pin 6?

I have changed the cutoff frequency from 1MHz to 300KHz because my frequency generator gives frequency upto 2MHz which is a small margin between 1MHz and 2MHz so for this i have changed so that i can have a lagre margin from 300KHz to 2MHz.
 
Last edited:
one thing more i am seeing the output on oscilloscope between output and the frequency (log scale)

As i increase the frequency the output shoudl decrease at 300KHz (as cutoff is at 300KHz). But this is not the case when practically doing it as i increase frequency its output incraeses. Am I doing right or wrong?

Am not using the dB on y axis as i canot understand when the 3 dB arises.

Its my project i still havent g0t the right output:(
 
Last edited:
When i designed the same filter circuit which you have sent me with the values having cutoff at 1MHz. I have simulated this circuit on Pspice but i am not getting the cutoff at 1MHz. Why i am getting changed cutoff ? when the circuit is same yours cutoff of the circuit you sent is 1MHz and i am simulating the same circuit i am getting cutoff at 300KHz why like this?
 
hi

I want the output from pin 2 (required ). Why u are taking output from pin 6. Any reason for taking output from pin 6?.

Because pin 6 is the output pin of the AD844, pin 2 is the INV input.
 

Attachments

  • AAesp01.gif
    AAesp01.gif
    13.7 KB · Views: 286
When i designed the same filter circuit which you have sent me with the values having cutoff at 1MHz. I have simulated this circuit on Pspice but i am not getting the cutoff at 1MHz. Why i am getting changed cutoff ? when the circuit is same yours cutoff of the circuit you sent is 1MHz and i am simulating the same circuit i am getting cutoff at 300KHz why like this?

Please post your Spice circuit diagram, where are you measuring the output of the AD844.?
 
https://imageshack.us/photo/my-images/688/unledkbf.png/

https://imageshack.us/photo/my-images/703/plotzn.png/

These two diagrams are my circuit and simualtion and it has a cutoff at 300KHz. I want this to be practically implemented on oscilloscope as well as spectrum analyzer.

I have connected frequency generator at the input of the lowpass filter and the oscilloscope at the output of filter. As i increase frequency the output voltage also increases it should have decreased but its increasing. At pin six for notch repsonse as i increase frequency the output voltage remain constant the at 16KHz it decreases and does not increases again.

M bit worried about this project as i its simulated response is showing 300KHz cutoff but practically this is not the case
 
hi,
I cannot see any reason why you do not get the same results as me.??

Is the circuit built on a bread board with good decoupling or a PCB.?

EDIT:
What is the output impedance of your signal generator.?
 
Last edited:
Hi

I have just made a simple passive filter now just to check I used 100pF capacitor and 10k ohm resitor its cutoff should be 159K Hz I gave input 1Vac.
but i am not getting output properly with 100pF capacitor but when im using 1uF capacitor now m getting proper output. I am seeing the results on oscilloscope.

Why is it so? because of smaller capacitor values?
 
Last edited:
I read one of your description about How bad RF circuits works on breadboard. I was implementing an active high pass filter on bread board. I didnt gett proper results. then i though first make a simple passive circuit( just to check ) I used 100pf capacitor and 10k resistor,I found when i was using 100pF capacitor i m getting output in mV but as i changed the capacitor to 1uF i got the output similar to input (applied 1VAC) from function generator.
Why is it so because of bread board or of capacitor?
 
Hi

I have just made a simple passive filter now just to check I used 100pF capacitor and 10k ohm resitor its cutoff should be 159K Hz I gave input 1Vac.
but i am not getting output properly with 100pF capacitor but when im using 1uF capacitor now m getting proper output. I am seeing the results on oscilloscope.

Why is it so? because of smaller capacitor values?

You should get a corner frequency of ~159kHz with 10K and 100pF

It must be either,
Your component values are not what you think they are.
You are not setting the signal generator correctly. wrong freq, not sine wave.
The scope is is not set correctly or you are misreading the screen.

It seems strange that ALL your previous results have been very different to what one would expect, you are doing something fundamentally wrong.

Post images of the scope showing just the input sine wave and also the response curve from the output of the filter.
 
Last edited:
Status
Not open for further replies.

Latest threads

New Articles From Microcontroller Tips

Back
Top