Continue to Site

Welcome to our site!

Electro Tech is an online community (with over 170,000 members) who enjoy talking about and building electronic circuits, projects and gadgets. To participate you need to register. Registration is free. Click here to register now.

  • Welcome to our site! Electro Tech is an online community (with over 170,000 members) who enjoy talking about and building electronic circuits, projects and gadgets. To participate you need to register. Registration is free. Click here to register now.

How to use FFT in LTspice

Status
Not open for further replies.
Typical of you, AG: you comment on some side issue. What I'm trying to resolve here is how to computer THD, not whether some particular amplifier sucks or not. (The whole point of the exercise being to attempt to make this amplifier suck less.)

Determining THD in LTSpice is simply a matter of placing a .four spice directive on the schematic. Here is how to do that:

First, click on the toolbar .op icon on the far right and enter the directive using this format;

.four <fund. freq> <number of harm.> <source trace> example- .four 1e3 50 V(out) which is 1khz fundamental 50 harmonics + fundamental evaluated at V(out)
The number of harmonics can be omitted with a default value of nine.

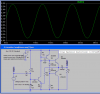
Next place the directive on the schematic, then go ahead and run the sim.

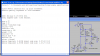
Last, right click on the plot pane, go down to the bottom of the dropdown and select View then Spice Error log. The results will be displayed there. If you want to look at several locations for a given sim, just add the traces to the directive.
 
Determining THD in LTSpice is simply a matter of placing a .four spice directive on the schematic. Here is how to do that:
I did it and got a Spice Error Log that makes no sense.
 

Attachments

  • Spice Error Log (distortion).PNG
    Spice Error Log (distortion).PNG
    42.2 KB · Views: 651
Determining THD in LTSpice is simply a matter of placing a .four spice directive on the schematic. Here is how to do that:

Thank you, thank you, thank you! Where were you 15 messages ago?

That is simple, and it agrees perfectly with my hand-computed result (via Excel spreadsheet, as described above), except that there's no mind-numbing copying down numbers!

By the way, you can view the error log by just selecting SPICE Error Log from the View menu.
 
@audioguru
LTspice shows output voltage, not output power
I've answered my own question by using the .four directive and doing some sums. In the FFT plot it is confirmed that the Y-axis shows power, not voltage.
 
I did it and got a Spice Error Log that makes no sense.

Perhaps you didn't read the statement that the .four statement contains an unknown. That is a formatting issue with the trace you identified...V(xxxx) sans the parentheses.
 
@audioguru

I've answered my own question by using the .four directive and doing some sums. In the FFT plot it is confirmed that the Y-axis shows power, not voltage.

How do you know this? Not challenging you, but the FFT plot only shows dB markings on the Y-axis. How do you know this is for power and not voltage?

Since the .four statement uses a parameter of 20 (instead of 10), I presume that means it's measuring power, not voltage.
 
Last edited:
I GOT IT! The total distortion of CarbonZit's amplifier with a peak input of 2V and a peak output of 1.2V is 3.87%.
With the same input and output levels the distortion of mine is 1.4%.

EDIT: But I can't do it on another LTspiceIV simulation because I got the same problem as I had with this one yesterday.
 
Last edited:
I GOT IT! The total distortion of CarbonZit's amplifier with a peak input of 2V and a peak output of 1.2V is 3.87%.
With the same input and output levels the distortion of mine is 1.4%.

BS.

See this post in that other thread where I show (according to LTspice, not me) that your design has a THD of 3.45%, while mine has a THD of 2.16%.

I invite you to run the simulations yourself and see the results.
 
I already deleted my simulation. My circuit has much less distortion when it is biased wrongly so its max output level is limited and is away from the first transistor in cutoff (like yours is).

A half-decent audio amplifier has much more open-loop gain that your simple and cheap one so that when negative feedback is used to reduce its gain from 100,000 to 30 then it reduces its distortion from 3% to 0.001%.

In the other thread I showed that my output distortion is higher than yours because my output level is 20 times higher than yours and your new gain is much less than mine.

Please don't make many threads about the same thing. Maybe a moderator can join them.
 
So do you think you can post a circuit that actually shows some improvement over mine (which currently stands at 2.16% THD)? How about just changing one thing at a time? I'm not in a big hurry here.
 
How do you know this? Not challenging you, but the FFT plot only shows dB markings on the Y-axis. How do you know this is for power and not voltage?
Since the .four statement uses a parameter of 20 (instead of 10), I presume that means it's measuring power, not voltage.

The .four directive will only use a parameter of 20 if that's the frequency, number of harmonics or measurement cycles you specify. That number doesn't signify a power measurement.
Your question is exactly the one I was asking earlier.
What I did to get the answer was use the directive .four 1k 5 v(out). (To keep things simple I only considered the first 5 harmonics).
I then ran the sim and looked at the error log, which gives the relative magnitudes (voltages) of the harmonics in the fourth column.
By finding log(base 10) of the magnitude of an arbitrary harmonic and multiplying by 20 I got a calculated dB value which coincided with the dB value obtained by using View/FFT and noting the Y-axis difference between the fundamental and the arbitrary harmonic. This establishes that the .four results (relative magnitude) must be voltage-derived whereas the dB in the FFT plot pane are 'proper' dB, i.e. power-derived. If that weren't the case then the multiplication factor needed to get the dB values to coincide would have been 10 rather than 20.
 
Last edited:
In FFT I noticed that the 0dB of the fundamental frequency was not lined up correctly since it was always too low. So I was shifting all the harmonics up so that it lines up correctly.
 
So do you think you can post a circuit that actually shows some improvement over mine (which currently stands at 2.16% THD)? How about just changing one thing at a time? I'm not in a big hurry here.
I think I posted this one in your other thread. I added a transistor for more open-loop gain then there is more negative feedback. This circuit has gain of 5.5 (almost 10 times more than yours). Its distortion is a little less than 0.1%.
 

Attachments

  • 4-transistors headphones amp.PNG
    4-transistors headphones amp.PNG
    33.9 KB · Views: 517
I'm going to post this in this thread since it's relevant here, if that's OK with you.

First of all, AG, I have to say, now we're getting somewhere!

Request: If you have a LTspice simulation posted, please attach the .asc file so others can run the simulation. It's a lot of work to come up with a matching schematic without making errors. (I think I did, but please check.)

First of all, I notice that you've sort of moved the goal posts with this latest posting, since you added a transistor and a little more complexity. But that's OK. We'll go with that.

So once again, AG, you're wrong. However, this time the error appears to be in your favor.

I ran your simulation (attached below) exactly as shown on your attached picture. According to LTspice, the THD is--get ready for this--0.070425%. Better than what you showed on your circuit (0.097446%: where did you get that figure from?)

Question: while I think this THD figure is correct (or at least believable), I'm not so sure about your gain calculation. Why are you taking the input current through R6 here? Shouldn't you be using the current from the input source? (This doesn't affect the THD calculation, only the power gain figure.)

By the way, concerning your comment that the fundamental was below 0dB in the LTspice FFT plot: I don't think this matters, as the THD analysis automatically normalizes all harmonics to the fundamental. (Look at the error log to see these numbers.)
 

Attachments

  • 3-transistor headphone amp (AG 2).asc
    3.1 KB · Views: 356
Last edited:
Trouble in paradise

I take no pleasure in reporting that, alas, your new design is no better than mine (just more complex).

Change your frequency to 1KHz. Run the simulation again.

The THD is almost exactly the same as mine, about 2.1%.

Too bad; I had high hopes when you posted this new circuit. (When you run my circuit--the 3-transistor one--at 100Hz, you get a low THD figure of 0.24%. Not as low as yours, but still respectable.)

Given the results of my experiment (i.e., actually listening to the earlier version of the amp with ~6% distortion), I think I can live with 2% THD, especially considering how simple this amp is. Don't worry, I'm not going to try to sell it to any audiophools!
 
I don't know why the distortion at 1kHz is much higher than at 100Hz. The transistors work well up to tens of MHz.
Maybe because there are too many cycles on the screen that are all broken up. Yes, this is the problem. I changed the startup time to show only a few cycles of 1kHz on the screen and the distortion dropped to 0.08%.

Here is my file:
 

Attachments

  • 3-transistor%20headphone%20amp%20(AG%202)[1].asc
    3.1 KB · Views: 314
hi agu,
Have you tried setting the maximum time step in .tran to 1uSec, then doing a FFT plot.?
 
In FFT I noticed that the 0dB of the fundamental frequency was not lined up correctly since it was always too low.
Probably because 0dB = 1V, or 1mV, or ..... (there are numerous definitions of '0dB', depending on the field of use, e.g. acoustics, electrical etc).
 
Last edited:
Status
Not open for further replies.

Latest threads

Back
Top