Electro Tech is an online community (with over 170,000 members) who enjoy talking about and building electronic circuits, projects and gadgets. To participate you need to register. Registration is free. Click here to register now.
Welcome to our site! Electro Tech is an online community (with over 170,000 members) who enjoy talking about and building electronic circuits, projects and gadgets. To participate you need to register. Registration is free. Click here to register now.
So, I'm trying to plot Vin vs Vout (Vin on the axis and Vout on the y-axis), but I can't figure out how to change the y-axis to represent Vout. I'm using LTspice. Any help will be MUCH appreciated
So, I'm trying to plot Vin vs Vout (Vin on the axis and Vout on the y-axis), but I can't figure out how to change the y-axis to represent Vout. I'm using LTspice. Any help will be MUCH appreciated
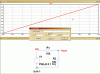
You can do it easily for a dc sweep (not in the time domain). Look at this example:
The independent variable of the simulation is the Voltage of V1, which sweeps linearly from 0V to 10V, and is the X-Axis in the plot.
I have plotted three dependent variables; the diode voltage V(d), the current through the diode I(D1), and the power dissipated in the resistor (green expression). These are plotted on the Y-Axis.
This site uses cookies to help personalise content, tailor your experience and to keep you logged in if you register.
By continuing to use this site, you are consenting to our use of cookies.