Continue to Site

Welcome to our site!

Electro Tech is an online community (with over 170,000 members) who enjoy talking about and building electronic circuits, projects and gadgets. To participate you need to register. Registration is free. Click here to register now.

  • Welcome to our site! Electro Tech is an online community (with over 170,000 members) who enjoy talking about and building electronic circuits, projects and gadgets. To participate you need to register. Registration is free. Click here to register now.

Erratic distortion results with LTSpice

Status
Not open for further replies.

tvrgeek

New Member
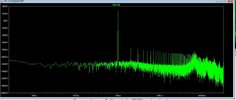
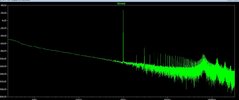
Depending on values, I get insanely optimistic calculations, (.000016% ) I can tweak to probable ( as circuit measured on the bench, more like .003%) or way poor ( .25%)

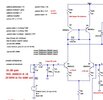
I have an ongoing project for fun to implement what I learn about class AB amplifier design past the one I built a few year back. I have read what I can understand bout the .tran and .fore statements, but there are some relationships I do not seem to get correct .
For example, if I increase my number of samples( by the time param) I actually get worse results. If I decrease them, they get worse. Not a trend I understand. I think I have the relationship between step and FFT size correct.
 

Attachments

  • lts params.JPG
    lts params.JPG
    52.1 KB · Views: 269
If you are seeing the start-up transient, that can significantly affect the distortion measurement.
For best results you want to look at many cycles of the waveform after it has reached steady-state operation.
 
I think I am . .param start (1/freq)*100

Settling time would make sense is a shorter stop time increased the distortion. It does, BUT, increasing it also does. So, if I run stop = 200, distortion rises. but so does it if stop = 5000. That does not explain how this amp simulates .000016% @ 1k, 60W. I mean it is good, but geeee. That is more like the value for a passive RC network.
 
Have you tried altering the 'maximum timestep' setting?
 
It is my understanding, it must be a multiple of the FFT. I am dividing the section to analyze by the FFT value.
As I understand, if this is not the case, it leads to more errors.
Do you have a better value?
 
It is my understanding, it must be a multiple of the FFT. I am dividing the section to analyze by the FFT value.
As I understand, if this is not the case, it leads to more errors.
Do you have a better value?

Try turning off data compression so no data is missed by adding this directive:
.opt plotwinsize=0

And

Set the maxtimestep value to (1/freq)*0.1
You can set this smaller but the simulation will get slower.

Also

For Transient anaysis:
2 VRMS = 2.828

For AC analysis:
AC 2
 
Last edited:
plotwinsize you will notice is the second parameter I set.

Using only time ( 1/Freq) or .0001 for 1K as a variable, gives me a value .035%.

I set it fixed to .0001525879 and I get 0.018% A number I might be inclined to believe.

But if I let it calculate (({stop} - {step})/FFT)*100 I get back to the .035 range. Gives the above step with a lot more digits but the same order of magnitude. Only the number of significant digits changed.

In other words, I can set step to anything and get any result.
There is a relationship I do not understand.

This link might help:
 
I have seen that. I wil glean his details further. Looks handy but I am trying to get correct results with fixed inputs.

I am not positive my method for measuring stability is correct either. Basically a Bode plot and look at the phase as it crosses zero gain as the feedback half of the input LTP. My noise simulations are not there yet.
No fault of LTSpice, but they do assume you know more about it. I went to school almost 50 years ago and did not use these things in my work, just hobby, so a bit fuzzy on memory.
 
Here is another puzzlement. The baseline slope. Very similar circuits. One is a slight modification. 60W MOSFET amp. I thought it was the input coupling cap, but it is bypassed. I believe all the parameters are the same. If one is not, I have not found it yet.
 

Attachments

  • Flat.JPG
    Flat.JPG
    86.6 KB · Views: 239
  • Slope.JPG
    Slope.JPG
    64 KB · Views: 242
OK, figured out the "slope problem. Cap in the feedback gain setting needs to be artificially large. like 1F. Actual is 100u. Same issue with my DC servo version, is the LF pole. It had me baffled because of a typo in one of my drawings just happened to be the clue.

One of my mods caused a very long settling time. I am doing that with just the "start" but I think there is a parameter just for that.

Now that leaves the confusion with the max time step and length of measured cycles. ( stop - start)
Basically, I can gat any calculated THD number I want by adjusting them. OK for comparing two ideas, but not for any idea of actual performance. There is something here I really do not understand. Logic would suggest the larger the time, the more accurate the value, but not so.

Am I correct, if I do the Bode plot and compare the phase on both sides of my input diff pair, measure phase difference at zero gain, that is the phase margin for stability? Spice seems a bit optimistic suggesting these amps have a zero gain at 4Meg. But, MOSFETS are fast. They do model about right, -1/2 dB @ 100K which is what I expect.
 
LTspice uses an adaptive time step numerical solver that adjusts the time step as required. This means that it chooses a variable time step depending on how fast the signals are changing. The initial default is 2% of the simulation time but will go to a smaller time step to maintain numerical accuracy and increase again to speed the simulation and still stay within the error tolerance. Frequency is the inverse of time, so this variable time slice shows up as spurious frequencies on an FFT analysis.

While LTspice does not let you use a fixed time step, it will allow you to limit the maximum time step. dTmax is the parameter that determines the maximum time step the simulator can take while integrating the circuit equations and can be used to minimize interpolation errors when automatic time step selection is too course.

By using a time step that relates to the FFT sample rate and the Nyquist duration frequency, the noise can be eliminated and the FFT baseline lowered. The relationship of dTmax in the .tran command line is

dTmax = (Dur X 0.5) / FFT Samples

FFT Samples is one of the settings available when selecting which waveform to include in the graphical FFT display. Dur is the duration of the transient analysis. A higher sample number permits higher noise-free test frequencies to be evaluated and has some effect on lowering the FFT baseline, but it also increases the simulation time. It is important for the FFT Samples in the transient analysis to agree with the FFT Samples when having LTspice provide an FFT graphic display or aliasing will be introduced.
 
Status
Not open for further replies.

Latest threads

New Articles From Microcontroller Tips

Back
Top