Continue to Site
Follow along with the video below to see how to install our site as a web app on your home screen.
Note: This feature may not be available in some browsers.
Are there any curves that would pass the vertical line test but cannot be represented by a function?
Hi,
The vertical line test is a pretty rigorous test in theory in that the
line would be infinitesimally thin, and that if on that line you could
find two or more points that the function generates then that
function can not be a 'true' function.
Of course in real life we often have to deal with multi valued functions
anyway and recognize when the function has to be broken up, and
that brings up other qualifying definitions of functions like,
real functions, differentiable functions, etc.
Sometimes we have to break the function up into two parts and
find the part that works for our application in the real world.
For example, if we had a circular function that generated a circle
we could get two solutions, one positive and one negative, and
we would have to test which one works in our real application.
Sometimes the solution is obvious though, such as if we calculate
the value of a resistor...if we get a negative and positive value we usually
assume it's the positive one.
This is really another topic but...
One simple function that is interesting is the y=int(x) function. We can
always calculate y knowing x, but we can not calculate x knowing y
because we get the same value of y for many many values of x.
ADDED LATER:
The vertical line test is used to test a function that already exists, so first
you have the function at hand, and then you test it. If it passes you assume
the function might be a function, but if it fails you know right then and there
that it is not a function.
Im sure there are functions that will pass the test but will not be differentiable,
so they could not be considered differentiable functions for example. By the
definition, "one value of y for any given x from -inf to +inf", they may be considered
functions though.
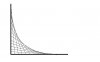
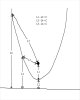
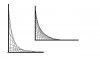
I've heard that y = x^2 defines a locus of points that are the ends of line segments whose difference of lengths is equal to a constant, .............
Is there a name for the curve that it might resemble if more lines were drawn?
I'm attaching a picture to this thread that I am hoping will communicate what I meant by subtracting the lengths of line segments. I understand how differentiation and integration can be used to change dimensions - and I think that this may involve a process that can geometrically be explained with tangent lines. I am interested in other types of lines that may be able to describe shapes in addition to tangent lines - and that is why I posted the question to which the picture that I have attached is related. Areas and volumes are a little too much for me to determine what shapes they might be related to. I was interested in knowing if lines - that weren't tangent lines, could also be used to geometrically describe y = x^3 and perhaps other equations. The only thing left besides areas and shapes having more dimensions are lines and points, and I'd be interested in knowing how many shapes can be described in terms of lengths of lines segments related to lines and points. I've heard about conic sections - and I'd like to know if lines and points could be used to describe these shapes as well as functions that have more than one finite maximum and minimum. The only other picture that has been posted to this thread is interesting. Is there a name for the curve that it might resemble if more lines were drawn? Are tangent lines a common method that is used to define curves? Can pictures such as that one be used to describe statistical methods?
Unless you want to get rid of all differential equations, this is alwaysAre tangent lines a common method that is used to define curves?
")
Hi again,
A good place to start is with the "least sum of squares" fit criterion.
With this technique, the data is run through the equation which generates
a 'y' value (called the 'predicted' value) and this value is subtracted
from the actual raw data 'y' value to generate an error 'err'. That error
is then squared, which is a good idea for a couple reasons. That squared
error is then summed with the other squared errors to form the 'sum of
squared errors' or simply the 'sum'. The coefficients are then varied
in an organized way until the least sum is found, and the coefficients that
resulted in that least sum are considered to be the best fit.
There are various techniques used to vary the coefficients in an orderly way,
including but not limited to what is called, "The method of steepest decent".
I think that would be a good place for you to start so you can get a feel for
what this is all about. Im sure if you look those terms up on the web all
sorts of articles will turn up. These topics fall under the general category of
"Numerical Analysis" and/or "Numerical Methods".
You could start with an equation that you are well familiar with, like
y=x^2+1 for example, then generate bogus data by adding a small random
sample to each y value to create say 10 values that are close to the
real value of y for each x. Then, use your new method to try to fit
y=k*x^2+1 to the data, and see what coefficient k you end up with for x
(it is ideally equal to 1, but assume you dont know that yet).
You could also experiment with varying the constant too, so you would start
with
y=k2*x^2+k1
When these fits are started it is sometimes a good idea to bound the constants
to something reasonable, depending on the application, such as -10<k<10 or
something like that.
Take a look on the web and see what you can find. It gets pretty interesting.
One of the most interesting techniques i have found in the past is the 'evolution'
fitting. This is probably the most extreme, where the idea is to set up a whole
group of equations that are made to evolve into a completely different equation,
and the one that gets the closest to the fit gets to 'live' to the next generation,
and the ones that are far off are killed off as soon as possible.
The beauty of this technique is that we dont have to know much about the equation
to begin with, but the drawback is it is very time consuming even on a fast computer
even for relatively simple formulas. I certainly can not advise to start with this however
if it is the first time you ever tried to fit an equation to data...it also doesnt teach much
about curve fitting in general.
The error function will certainly pass the vertical line test, but it is not an "elementary function". It is computable only as an approximation to a definite integral which means there is no way to compute exact values.Are there any curves that would pass the vertical line test but cannot be represented by a function?
Is evolution fitting a nickname for something that I can look up on the web? I'm interested in learning how continuous and comprehensive evolution fitting is. I eventually plan on finding a math site at a University and looking for a layperson's description of the topics - if there are such descriptions. I think that this may help learn more about curves and shapes of best fit. Any suggestions for finding such a descriptive list? How many of these topics are covered by evolution fitting?
Hello,
If you remember, i suggested looking at the least sum of squares fitting
first. You should get a firm grasp of how this works before moving
to other types of fitting.
Evolutionary fitting (other names perhaps) is a way of experimentally
trying different functions in order to try to fit a set of functions to
a given set of data. It is different than other types of fitting because
i does not use a mathematically sound technique to find the best fit,
but rather mimics nature in trial and error similar to how evolution 'works'.
Try the least squares fitting first and see if that begins to make sense
to you, then i'll help you move to other types of fitting if you prefer.
I dont know any other names for it but you can ask around other sites.
Hi again,
I myself dont know of any other name for it. Perhaps someone else does?
I suggested least sum of squares because it is somewhat popular and it
is widely used and will get you started with curve fitting in general.
It is used as the basis of other curve fitting techniques too.
What it looks like to me is that you are attempting to understand some of
the more advanced topics in mathematics before learning some of the basics.
This is going to be very hard to do if not impossible. Normally courses take
you through some rudimentary fundamentals and then you work your way
up to the more difficult stuff. If you try the difficult stuff first, you end up
constantly referring back to the other stuff anyway so you should really have
that under your belt first. It also makes life easier that way. You also end
up answering many of your own questions that way too and it's kinda fun to
do that.
Im not totally sure if what we have been calling 'evolutionary' fitting would do
you any good or not, but unfortunately you'll have to find some references
on the web in order to make any use at all of this, if it is possible.
If you cant find anything i can check around a bit and see if i can locate any
info on this...