StudentSA
Member
Good Day,
Firstly I am a complete beginner in RF design but please bear with me. I would like to understand a little more about antennas, lets take a di-pole for eg. I would like to know what electric signal would i measure at the connection point? so if i hooked up an appropriate oscilloscope what would I see? I need to understand this so that I can build on what the RF amp stage is trying to accomplish.
I have this possibly crazy perception form my readings that an antenna could be considered like a band pass filter? meaning that the more you deviate from the quarter(or was it half) wavelength the less signal you will pick up at that frequency.
Thanks,
StudentSA
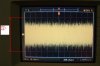
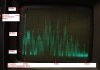
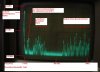
 . The 23:00 vs the 16:00 readings really intrigues me, is it that more broadcasts are happening at night or does it have something to do with the atmosphere and how some signals bounce back easier at night? I was really amazed at how distinctly you can see the different bands in figure 2.
