summitville
Member
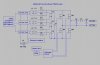
Can anyone interpret the attached FFT File? This is the FFT analysis of a Bubba Oscillator making a 60Hz Waveform. I see a single peak at 60 Hz, the lower frequencies drop below -30db and the higher frequencies drop below -45db. Is that GOOD? Does the FFT graph indicate that the Bubba Oscillator is creating a true sine wave with less than 1% Distortion?
Thank You,
Thank You,