Any node voltage or branch current plotted on an LTSpice Bode plot by default is plotted in db with respect to the main AC voltage source or AC current source used for the .AC analysis run.
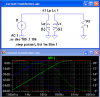
In Roff's attachment, the independent variable of the simulation is the frequency of the I1 current source. The amplitude is 1A.
The dependent current through R1 shown as I(R1) Green trace on the plot is decibels relative to the 1A that I1 supplies. To the right of the corner frequency, I(R1) approaches the same value as I(I1)=1A, so the value approaches 0 db, which is a gain of 1 due to the turns ratio of the transformer. Remember that db of a current ratio is 20log(I2/I1).
At 1Hz, the green trace is down more than -42db, so the actual current through R1 would be
-42 = 20*log[I(R1)/1]
- 2.1 = log[I(R1)]
I(R1) = 10exp(-2.1) = 0.0079A = 7.9mA
(-40db is a factor of 1/100)
btw-you can turn off the db mode in an LTSpice Bode plot, and plot the ratio directly as a real and imaginary or magnitude and phase.
Roff will have to explain what the red and blue traces are?