After reading a thread started by "The Mad Professor" I start to experiment with this light-sensing-LED-thing. You can find the original thread here: https://www.electro-tech-online.com/threads/now-thats-a-project.22064/
Circuit:
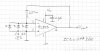
You can see the circuit I made in attached file "Circuit.jpg"
Measurements:
With a multimeter between Vout and GND one can measure:
1) +4.996V (Vcc) in full light.
2) Decreasing voltage with decreasing light intensity.
3) +2.514V (Vcc/2 ?) with LED’s completely covered.
So everything is looking good, decreasing light intensity equals decreasing voltage.
I feed a TLC549 ADC with this output voltage, write some code for a 80C31 µP and put the readings on a LCD display. What I saw on the LCD?
1) Fixed data 255 in full light.
2) Continuous varying data between 0 and 255 with decreasing light and no light at all.
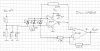
I then placed a scope on Vout and that’s what I saw, very weird…
You can see the signals in attached file "Signals.jpg"
Questions:
These measurements solved the 0 and 255 ADC readings on the LCD but bring even more questions on. So, can some explain these signals to me?
1) Why constant Tlow= 5ms as long as 0 volt isn’t reached and then increasing from 5 to 10ms with Vout= 0V and still decreasing light?
2) Where is the 50Hz signal (no light) coming from? During the measurements, no power line light sources where on, only bright constant sunlight. Don’t tell me the sun is pulsing at 50Hz…
3) Are these signals typical for LED’s or is there something wrong with my opamp circuit? Even with other LED’s, red and green one’s, the same type of signals but with lower levels…
4) What do I need to “convert” such a signal to an averaged signal and stable ADC readout like the one on my multimeter (filter, caps, …)?
5) All suggestions to read such a signal in a µP with an ADC are welcome… …
Thanks for any reaction...
Circuit:
You can see the circuit I made in attached file "Circuit.jpg"
Measurements:
With a multimeter between Vout and GND one can measure:
1) +4.996V (Vcc) in full light.
2) Decreasing voltage with decreasing light intensity.
3) +2.514V (Vcc/2 ?) with LED’s completely covered.
So everything is looking good, decreasing light intensity equals decreasing voltage.
I feed a TLC549 ADC with this output voltage, write some code for a 80C31 µP and put the readings on a LCD display. What I saw on the LCD?
1) Fixed data 255 in full light.
2) Continuous varying data between 0 and 255 with decreasing light and no light at all.
I then placed a scope on Vout and that’s what I saw, very weird…
You can see the signals in attached file "Signals.jpg"
Questions:
These measurements solved the 0 and 255 ADC readings on the LCD but bring even more questions on. So, can some explain these signals to me?
1) Why constant Tlow= 5ms as long as 0 volt isn’t reached and then increasing from 5 to 10ms with Vout= 0V and still decreasing light?
2) Where is the 50Hz signal (no light) coming from? During the measurements, no power line light sources where on, only bright constant sunlight. Don’t tell me the sun is pulsing at 50Hz…
3) Are these signals typical for LED’s or is there something wrong with my opamp circuit? Even with other LED’s, red and green one’s, the same type of signals but with lower levels…
4) What do I need to “convert” such a signal to an averaged signal and stable ADC readout like the one on my multimeter (filter, caps, …)?
5) All suggestions to read such a signal in a µP with an ADC are welcome… …
Thanks for any reaction...
")