Continue to Site

Welcome to our site!

Electro Tech is an online community (with over 170,000 members) who enjoy talking about and building electronic circuits, projects and gadgets. To participate you need to register. Registration is free. Click here to register now.

  • Welcome to our site! Electro Tech is an online community (with over 170,000 members) who enjoy talking about and building electronic circuits, projects and gadgets. To participate you need to register. Registration is free. Click here to register now.

jumps in output graph in sat. region JFET

Status
Not open for further replies.

Karkas

Member
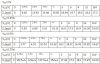
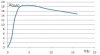
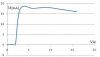
Good night. I have a lab report to do, of de transfer graph and the output graph of a JFET, and happens that for the output i have a pronunciated jump in the saturation region, that goes from 152µA to 17,42 mA and then it remains almost constant there, i made that measurement three times before changing my power supply, and after that i obtained the same results, waht could had happened here?
Here are the tables attached.

Please accept my apologies about the language in the images, as you can see I'm in latin amercia and that's the language in the document and i couldn't change it.

Thanks ahead of time.
 

Attachments

  • curva de transfernecia JFET.JPG
    curva de transfernecia JFET.JPG
    22.6 KB · Views: 403
  • curvas de salida JFET.JPG
    curvas de salida JFET.JPG
    51.4 KB · Views: 457
It is normal.
When the drain-source voltage is more than the pinchoff voltage then the FET begins conducting well.
Below the pinchoff voltage then it conducts poorly.
 
Thanks for the answer, but I sketched quickly the last two tables in excel and this is what I obtained, and it doesn't look like it has to, at least until i had studied.

The firs graph is for Vgs= 0.5Vp
and the second for Vgs=0.75Vp

in there you can't see veru well the saturation region, I mean it doesn't remain constant enough
 

Attachments

  • 0.5Vp.JPG
    0.5Vp.JPG
    13.5 KB · Views: 310
  • 0,75Vp.JPG
    0,75Vp.JPG
    9.9 KB · Views: 316
Last edited:
What methods are you using to measure VDS and ID?
 
Last edited:
Direct method, i think that's what you mean, i had an amperemeter stuck in series between the power supply and Rd and, by stuck i mean that it is constantly there and the voltmeter is used in every step and it is not stuck, I think that's what you mean.
Thanks for the answer.
 
I don't know why you're seeing this. You should get a pretty flat slope in the saturation region. I would try different meters, power supplies...

Also, try to determine if the temperature of the JFET is changing.
 
Last edited:
Well i'll check that, but ichanged my power supplies when i saw that values, and i'm sure it was the transistor, because i obtained the same results, i tried to change the transistor but the other ones where not even working.
So any idea about what this would be happening?
 
You show a 1k resistor in series with the drain, but it apparently isn't actually there.
I think your problem is self-heating. JFETs have a temperature coefficient that causes the current to decrease as the temperature goes up. In your circuit, the power dissipation increases as Vds increases, causing the current to decrease, resulting in the strange curves you posted. To make accurate measurements, you have to apply very low duty cycle pulses to either Vds or Vgs, so the device doesn't heat. You can't make the measurements with a multimeter, as it will give you something resembling average current.
 
Thanks for the answer.
You mean i have to turn on/off the power supplies as i'm measuring the values?
or you're talking about a waveform?
 
Thanks for the answer.
You mean i have to turn on/off the power supplies as i'm measuring the values?
or you're talking about a waveform?
If you have a fairly fast-responding ammeter, put a pushbutton switch in series with the drain circuit. Set the supply voltage (which will become Vds when you push the switch) with the switch open (no current). Make the measurement as soon as you can after you push the button. If you are manually changing Vds, this should allow enough time for the transistor to cool before the next measurement. Be aware that the problem is worst when Vds is highest, and Vgs=0 (Ids=Idss), because this is where the power dissipation is highest.
You should be able to see the drift problem by holding down the switch and watching the meter. If you don't.....

NEVER MIND!:eek:
 
Last edited:
Thanks again. I'll check that on the lab and on the graphics, I may reply again because I have to evaluate the graphics again.
 
Status
Not open for further replies.

Latest threads

New Articles From Microcontroller Tips

Back
Top