Electro Tech is an online community (with over 170,000 members) who enjoy talking about and building electronic circuits, projects and gadgets. To participate you need to register. Registration is free. Click here to register now.
Welcome to our site! Electro Tech is an online community (with over 170,000 members) who enjoy talking about and building electronic circuits, projects and gadgets. To participate you need to register. Registration is free. Click here to register now.
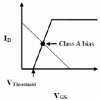
I'm reading an article on MOSFET based amplifiers and saw the next figure:
I think this figure is incorrect as you can't draw IDS without knowing both VGS and VDS.
Moreover, IDS is always dependant on VGS, so it doesn’t remain constant as VGS goes up.
It's not incorrect: it's merely showing you the curve for one particular (unspecified) value of Vds. You'd get similar shaped curves (albeit with different slopes and plateaux) for other values of Vds.
Moreover, IDS is always dependant on VGS, so it doesn’t remain constant as VGS goes up.
Not so. The curve shows that Ids increases with Vgs up to a certain point. Beyond that point there's a plateau, where Ids is almost constant as Vgs increases.
I don't see anything wrong with the device curve (Ids vs Vgs), but the "load line" doesn't make sense. Class A operation does require biasing somewhere near the middle of the curve, but I don't know what the straight line represents.
This site uses cookies to help personalise content, tailor your experience and to keep you logged in if you register.
By continuing to use this site, you are consenting to our use of cookies.