Continue to Site

Welcome to our site!

Electro Tech is an online community (with over 170,000 members) who enjoy talking about and building electronic circuits, projects and gadgets. To participate you need to register. Registration is free. Click here to register now.

  • Welcome to our site! Electro Tech is an online community (with over 170,000 members) who enjoy talking about and building electronic circuits, projects and gadgets. To participate you need to register. Registration is free. Click here to register now.

How to alter LTspice simulation graph to show x-axis in decreasing resistance rather than increasing

Status
Not open for further replies.

SuzanneOC

New Member
I am modelling the voltage output of a basic circuit with respect to decreasing variable resistors. However the resistance is shown increasing(x-axis) in my graph rather than decreasing. Is there a way to alter the graph?
 

Attachments

  • resistor circuit.asc
    1.3 KB · Views: 374
In fact, is there a way to plot the simulations from LTspice and edit axes, units, title etc? For inclusion in a report.
 
Why do you care about reversing the X-axis? The information you asked the simulator to get you is all in the plot.

Here is a much better way of presenting the plotted data: Note how I modified the .STEP command to make the simulation run 50x faster than yours. Note how much easier it is to read the log plot.

rc.gif


I took some liberties with your circuit, trying to figure out what you actually wanted to do. I didn't understand R5/R6 in your circuit.

Did you really need to connect a 1KΩ resistor R1 in-series with a voltage source that already has a 1KΩ internal resistance?
 
Last edited:
Hi

I agree with MikeML, however...

If you really want to show a decreasing value you can change the horizontal axis "Quantity Value" from R to -R
But the quantity will be shown as a negative value.
 

Attachments

  • RPlot.png
    RPlot.png
    38 KB · Views: 477
In fact, is there a way to plot the simulations from LTspice and edit axes, units, title etc? For inclusion in a report.
You can modify axis increments and values by left-clicking he desired parameter axis on the graph.
You can add graph annotations by clicking on Notes and Annotations under the Plot Settings Tab.
 
You can modify axis increments and values by left-clicking he desired parameter axis on the graph.
You can add graph annotations by clicking on Notes and Annotations under the Plot Settings Tab.

Yes, i tried that also but it wont look right in a report.

Is there a way to export the simulated data to excel for plotting against another parameter?
For instance, from this simulation I would like to take the output voltage values and plot them against a non-electrical parameter.

Is it possible to export data from LTspice?
 
Here's another way to plot the result.

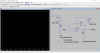
I've modifed the R value calculation to help convergence.
Notice I've change the analysis to .tran and added a .meas statement.

There are some other mods but I'll let you review the schematic I posted.

Anyway, Run the simulation (it takes about 5 minutes to complete).
After it completes:
1. View->Spice error log.
2. Rht-clk the any of the ".step r=nnn" row entries
3. select "Plot .step'ed .meas data" from the pop-up menu.
a new graph will appear
4. Rht-clk in the new graph
5. Select "Visible Traces"
6. Select "Out"from the pop-up menu, to add the Out measurement to the graph
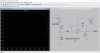
The Output should now be shown in the graph.

After doing step 6, the new graph should show a decreasing R value in the horizontal axis and the Output voltage in the vertical axis.

See attached.
RPlot.png
 

Attachments

  • RSim.png
    RSim.png
    34.3 KB · Views: 391
Status
Not open for further replies.

Latest threads

New Articles From Microcontroller Tips

Back
Top