Electro Tech is an online community (with over 170,000 members) who enjoy talking about and building electronic circuits, projects and gadgets. To participate you need to register. Registration is free. Click here to register now.
Welcome to our site! Electro Tech is an online community (with over 170,000 members) who enjoy talking about and building electronic circuits, projects and gadgets. To participate you need to register. Registration is free. Click here to register now.
Hi G,
I'm a bit blind to numbers, so any visualisation is helpful.
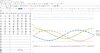
Turning a compass modules 360° while READing the XYZ sensors, I filled in a spreadsheet, and turned it into a SINE wave graph.
There are 2x sets of numbers 1/ with the Z axis turned upward, and 2/ With the Z axis turned downward.
Here is an image of the screen: Showing 15° divisions. On the left of the image is the 6x READings.
The SINE waves are a bit flat, I think due to the Z axis READouts top and bottom, being a wider scale, so the Graph isn't square.
C
This site uses cookies to help personalise content, tailor your experience and to keep you logged in if you register.
By continuing to use this site, you are consenting to our use of cookies.