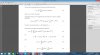
I have used Fourier series to calculate the frequency spectra of a periodic unipolar square wave (i.e. 50% duty cycle) with amplitude A and found the line spectra to exist at 0 Hz and odd harmonics of the fundamental frequency. The line spectra do not exist for even harmonics.
The amplitude at 0 Hz is A/2 and for the n th odd harmonic = (2 x A)/(n x pi).
I then used the Fourier Transform to calculate the frequency spectra of a unipolar square wave (i.e. 50% duty cycle) with amplitude A for
1. One complete cycle with period T and fundamental frequency f=1/T
2. Two complete cycles, one after the other, each with a period T/2 and fundamental frequency f=2/T. Total time T.
3. Three complete cycles, one after the other, each with a period T/3 and fundamental frequency f=3/T. Total time T.
4. Four complete cycles, one after the other, each with a period T/4 and fundamental frequency f=4/T. Total time T.
and found the line spectra to exist at 0 Hz and odd harmonics of the fundamental frequency. The line spectra do not exist for even harmonics.
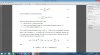
The amplitude at 0 Hz is AT/2 and for the n th odd harmonic = (A x T)/(n x pi). As expected the line spectra increase in amplitude as the number of complete cycles within the time T increases.
However I cannot see when the line spectra of the Fourier transform would equal that of the Fourier transform ? Ate the equations for the line spectra correct ?
The amplitude at 0 Hz is A/2 and for the n th odd harmonic = (2 x A)/(n x pi).
I then used the Fourier Transform to calculate the frequency spectra of a unipolar square wave (i.e. 50% duty cycle) with amplitude A for
1. One complete cycle with period T and fundamental frequency f=1/T
2. Two complete cycles, one after the other, each with a period T/2 and fundamental frequency f=2/T. Total time T.
3. Three complete cycles, one after the other, each with a period T/3 and fundamental frequency f=3/T. Total time T.
4. Four complete cycles, one after the other, each with a period T/4 and fundamental frequency f=4/T. Total time T.
and found the line spectra to exist at 0 Hz and odd harmonics of the fundamental frequency. The line spectra do not exist for even harmonics.
The amplitude at 0 Hz is AT/2 and for the n th odd harmonic = (A x T)/(n x pi). As expected the line spectra increase in amplitude as the number of complete cycles within the time T increases.
However I cannot see when the line spectra of the Fourier transform would equal that of the Fourier transform ? Ate the equations for the line spectra correct ?
")