Continue to Site

Welcome to our site!

Electro Tech is an online community (with over 170,000 members) who enjoy talking about and building electronic circuits, projects and gadgets. To participate you need to register. Registration is free. Click here to register now.

  • Welcome to our site! Electro Tech is an online community (with over 170,000 members) who enjoy talking about and building electronic circuits, projects and gadgets. To participate you need to register. Registration is free. Click here to register now.

How can I find H(s) from its shape?

Status
Not open for further replies.

hanhan

Member
Hi,
I have a class about Control Theory (not sure if I translate it right) in this semester.
To be honest, I don't know any terminology about this subject in English. Therefore, I have drawn a picture here. Hope you can understand it and help me.
control-theory-jpg.74860

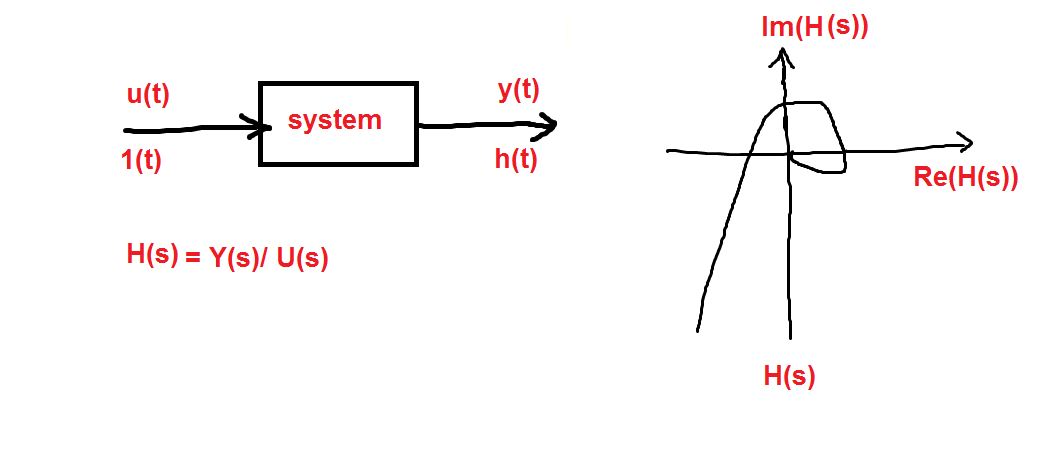
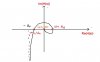
I need to find a general form of H(s), something like this:
H(s) = 1/(1 + T1*s) * (1/ (1 + T2*s) where T1 and T2 are constants.
Could you tell me how can I know the general form of H(s) that has the shape as in the picture?
And if you know about this, please suggest me some key words to search for? I want to read more about this.
 

Attachments

  • Control theory.JPG
    Control theory.JPG
    33 KB · Views: 502
There are a few ways you can try to extract transfer functions from plots or data.

There is the well known Prony method https://en.wikipedia.org/wiki/Prony's_method , but I don't recommend that here, because Prony's method is better if you have the time domain information for h(t), where H(s) is the Laplace transform of h(t). Since you already have the frequency domain information, there are probably better ways to get the transfer function.

In this case, I would plot the magnitude and phase of the H(s). The magnitude is sqrt(Re(H)^2+Im(H)) and the phase is arctan2(Im(H),Re(H)) . Then use Bode plot rules to identify the poles and zeros of the system. If the system is simple, the form of H(s) will be very obvious, but even in complicated systems it should be possible to extract the information. https://en.wikipedia.org/wiki/Bode_plot
 
Hello there,

I have a couple of questions...

1. In the plot is the point drawn close to (0,0) actually at (0,0)?
2. Is the point (0,0) or close to that at 0 frequency or at infinite frequency or some other frequency?
3. Is the other end of the plot (the longer straighter arm) approaching an asymptote?
4. Is a second order transfer function acceptable?
 
Thanks for help.
1. In the plot is the point drawn close to (0,0) actually at (0,0)?
It is (0,0).
2. Is the point (0,0) or close to that at 0 frequency or at infinite frequency or some other frequency?
It is infinite frequency.
3. Is the other end of the plot (the longer straighter arm) approaching an asymptote?
Yes, you are right. My mistake.
4. Is a second order transfer function acceptable?
Yes.
Sorry for the confusion. I have redrawn the picture here:
hs-jpg.74891


There are a few ways you can try to extract transfer functions from plots or data.

There is the well known Prony method https://en.wikipedia.org/wiki/Prony's_method , but I don't recommend that here, because Prony's method is better if you have the time domain information for h(t), where H(s) is the Laplace transform of h(t). Since you already have the frequency domain information, there are probably better ways to get the transfer function.

In this case, I would plot the magnitude and phase of the H(s). The magnitude is sqrt(Re(H)^2+Im(H)) and the phase is arctan2(Im(H),Re(H)) . Then use Bode plot rules to identify the poles and zeros of the system. If the system is simple, the form of H(s) will be very obvious, but even in complicated systems it should be possible to extract the information. https://en.wikipedia.org/wiki/Bode_plot
I will read it and ask latter. I can't understand it now.
 

Attachments

  • Hs.JPG
    Hs.JPG
    30.9 KB · Views: 442
Last edited:
Hi again,

Quick question:
Your new drawing has Real and Imag axises swapped. Is this the correct version now ?
Interesting, the phase shift at w1 is 90 degrees but the phase shift at wd is -90 degrees. Is this right?
In fact, the plot seems to go from possibly 180 degrees through -90 degrees and then through 0 degrees then through +90 degrees and then through +135 degrees and the even possibly back to 180 degrees, thus making a complete rotation around the origin. Is this even possible with a single second order system?
 

Attachments

  • Plot01b.gif
    Plot01b.gif
    15 KB · Views: 263
Last edited:
Your new drawing has Real and Imag axises swapped. Is this the correct version now ?
Opps, a silly mistake!:eek: 
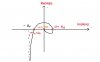
It should be swapped.
Here is the new one:
hs-jpg.74899

Interesting, the phase shift at w1 is 90 degrees but the phase shift at wd is -90 degrees. Is this right?
In fact, the plot seems to go from possibly 180 degrees through -90 degrees and then through 0 degrees then through +90 degrees and then through +135 degrees and the even possibly back to 180 degrees, thus making a complete rotation around the origin. Is this even possible with a single second order system?
Now I have changed the picture. Please help me again.
If I remember correctly my teacher said it is fifth order system but I am not sure.
 

Attachments

  • Hs.JPG
    Hs.JPG
    40.5 KB · Views: 452
Does this have the form bellow?
H(s) = 1/(s*(s+a)(s+b)(s+c)(s+d))
I don't remember well but my teacher has said something like this:
If H(s) encircles quadrants N times then H(s) is Nth order system. If you know anything about this, please let me know.
 
Looks correct to me. But, you might need a scale factor (gain) with it. I would start with H(s)=A/(s*(s+a)(s_b)(s+c)(s+d)).

Do you have the exact data to make the plots? Or, are you going by a sketch only? There are 5 constants (A, a, b, c and d) that must now be found. It's easy if you have the full data. If you have only the sketch, you need to use the key features of the sketch to solve for the unknown constants.
 
Thanks, it is an exercise in a test a month ago. There is only the sketch. I remember that we use the approximation:
Something like this (not exact!!!) I can't remember it now.
H(s)=A/(s*(s+a)(s_b)(s+c)(s+d)) ≈ A/(s*(s+p)^4)
Just curious, how do you know that the system has five poles? Do you use the Bode plot as you said above?
 
Yes, I prefer to use the Bode plot because the information is clearer to me that way. A good Bode plot is much easier to read because the frequency parameter is clearly shown across the entire plot.

But you can also see it in the Nyquist plot you showed. It's clear the phase angle is 270 degrees (or -90 degrees) at ω=0. And, the magnitude is infinity at ω=0. This is a clear indicator of a pole at s=0, which is an integrator. Then the phase rotates continuously as ω increases, which indicates the addition of poles. Since the total phase rotation is 360 degrees from ω=0 to ω=∞, there must be 4 more poles (-90 deg per pole).

However, we always need to keep in mind that there might be a pole and a zero that are nearly canceling and would be hard to see from a sketch. The precise real data would reveal this, and it would be easier to see details like this on a Bode plot. But, if you are using a sketch, then it is reasonable to make the assumptions you made. By the way, don't use -a in your sketch because it will get confused with your s+a term in the transfer function. Let's call the "a" in the sketch α (alpha) instead.

The interesting features of the plot are as follows.

Re{H(ω=0)}=-α
Im{H(ω=0)}=-∞
Re{H(ω=ω0)}=-p (where p can be measured as the distance from the origin where the curve crosses the horizontal axis at ω=ω0
Im{H(ω=ω0)}=0
Re{H(ω=ω1)}=q (where p can be measured as the distance from the origin where the curve crosses the horizontal axis at ω=ω1
Im{H(ω=ω1)}=0
Re{H(ω=∞)}=0
Im{H(ω=∞)}=0

This may not be enough information to calculate all constants in your transfer function, but you can try to pick off more data points.
 
Thanks, it is an exercise in a test a month ago. There is only the sketch. I remember that we use the approximation:
Something like this (not exact!!!) I can't remember it now.
H(s)=A/(s*(s+a)(s_b)(s+c)(s+d)) ≈ A/(s*(s+p)^4)
Just curious, how do you know that the system has five poles? Do you use the Bode plot as you said above?

Hello again,


Well, that makes the problem a whole heck of a lot simpler now :)

H(s)=1/(s*(s+p)^4)

and you can play with the scale factor A if you wish to change 'a'.

If we can use the quad pole as above we can rap this up in a jiffy by noting a few points similar to what Steve was mentioning, and it does not require too much work.

First, note that the imaginary part is zero for three different values of w: w(inf), w1, and w0. That means we should try to solve for that first.
Now because we have an 's' as a lone factor in the denominator and no 's' in the numerator, we right away satisfy w(inf). So we have that already.
Next, we solve for H(jw) and find the imaginary part:
H(jw)=H(s) with s=jw, then
IP(w)=ImagPart(H(jw))

Now we set that equal to zero:
IP(w)=0

and solve for all the w. The solutions we want are:
w0=(sqrt(2)-1)*p, and
w1=(sqrt(2)+1)*p
We know w1>w0>0 so they are easy to pick out of all the possible solutions.

Now to find a, we solve for the real part:
RP(w)=RealPart(H(jw))

and take the limit as w goes to zero:
limit [w-->0] RP(w)

and we get:
RP(0)=-4/p^5

so a=4/p^5.

Next we can check the response at w=0 to make sure it is infinite, and at w=inf to make sure it is zero, and it is.

To change 'a' independently of w0 and w1, calculate w0 and w1 as above, then include A and make 'a' such that:
a=4*A/p^5

however A will have to be constrained in order to maintain a graph that looks much like that in the picture.
Note: A is the gain in the numerator which replaces that '1' as shown in your quote.


So all you need to do really is find Hjw and the rest is pretty easy. If you have any problems with this just yell :)
 
Last edited:
I think you should first learn how to draw Nyquist plots by hand and then you understand how to interpret them "backwards".

Edit: Mickey Mouse as Nyquist plot
 
Last edited:
Status
Not open for further replies.

Latest threads

New Articles From Microcontroller Tips

Back
Top