koolguy
Active Member
I was just thinking how Digital filters work in case of analog we just connected
RC to the signal input to amplifiers, etc
but in case of Digital filter....what happen??
In case of analog low pass filter with connect R and C by using cut of frq. F=1/(2*PI*R*C)....and analyzing by Bode plot.
But this how really work in digital filters??
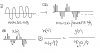
The input isin form of 010101010 if i want low freq. output of digital signal then what to do??
thanks
RC to the signal input to amplifiers, etc
but in case of Digital filter....what happen??
In case of analog low pass filter with connect R and C by using cut of frq. F=1/(2*PI*R*C)....and analyzing by Bode plot.
But this how really work in digital filters??
The input isin form of 010101010 if i want low freq. output of digital signal then what to do??
thanks
") They are defined only for that sample time.
They are defined only for that sample time.