savvej
Member
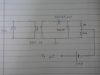
I am using atmega 32 adc for data capturing. And sending the captured data via serial port to PC for plotting.I am using sine wave source as the transformer secondary 12V output with clamping circuit and resistor didvider followed to get output in range of 0-5V(with an additional offset of 1.5 dry cell connected in series with the output).The circuit diagram is attached with the post.
Baud rate for serial communication =38400
No. of reading taken=1024
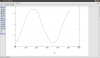
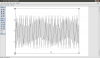
Now with above said when I do data capturing,what I get is a highly noisy output of the sine wave which is kind of amplitude modulated where in you can see another sine wave(photo of graph attached).Now why is it so?(its not noise because amplitude of sine wave(like carrier amplitude in AM) is quite big and the amplitude of sine wave inside it(you will understand when you see the graph) too is same.
What should I do so as to get a nice Sine wave?
PS. the data plotted in graph(plotted using xmgrace in ubuntu) is for first 100 points
PS. also attached is "data.txt" file incase if you have other plotting software
Baud rate for serial communication =38400
No. of reading taken=1024
Now with above said when I do data capturing,what I get is a highly noisy output of the sine wave which is kind of amplitude modulated where in you can see another sine wave(photo of graph attached).Now why is it so?(its not noise because amplitude of sine wave(like carrier amplitude in AM) is quite big and the amplitude of sine wave inside it(you will understand when you see the graph) too is same.
What should I do so as to get a nice Sine wave?
PS. the data plotted in graph(plotted using xmgrace in ubuntu) is for first 100 points
PS. also attached is "data.txt" file incase if you have other plotting software
")