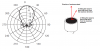
Continue to Site

Welcome to our site!

Electro Tech is an online community (with over 170,000 members) who enjoy talking about and building electronic circuits, projects and gadgets. To participate you need to register. Registration is free. Click here to register now.

  • Welcome to our site! Electro Tech is an online community (with over 170,000 members) who enjoy talking about and building electronic circuits, projects and gadgets. To participate you need to register. Registration is free. Click here to register now.

polar

Status
Not open for further replies.
Sorry but your questions do not make sense, at least to me they dont.

Can somebody tell me why the Y axis decreases in values while it approaches to the sensor??!!
Uh?
The polar plot has the rings scaled in dB, the outer ring is 0dB (the reference level), the inner rings are scaled in steps of 6dB, down to -30dB.

The radial lines indicate the angle in degrees from the direction of maximum response of the transducer.

By the way where pint the 0 value indicates to??
Sorry, I have no idea what you are asking.

JimB
 
The polar plot shows the output of the transducer versus the angle from the transducer on-axis point. The values on the perimeter are the degrees off axis from the direction the transducer is pointing. 0 (degrees) is the on-axis (maximum output direction) of the transducer.

The somewhat oval trace shows how the transducer output drops off as you move away from the on-axis point. Thus, for example, at 30 degrees off-axis, the output will be about -9dB below the maximum (on-axis) output. The squiggles at the backside of the transducer (90 to 270 degrees) show that there are some low level side-lobe signals at the back (maximum about -25dB at 90 and 270).
 
Those are the levels in db for the concentric rings of the graph. Under test, the sensor is placed in a specific location in the test chamber and is rotated while a fixed source at a fix level and frequency radiates. The output level of the receiving device is measured and plotted throughout the rotation yielding the graph as shown displaying the beam angle lobes.
 
Sorry but your questions do not make sense, at least to me they dont.


Uh?
The polar plot has the rings scaled in dB, the outer ring is 0dB (the reference level), the inner rings are scaled in steps of 6dB, down to -30dB.

The radial lines indicate the angle in degrees from the direction of maximum response of the transducer.


Sorry, I have no idea what you are asking.

JimB


Thanks for all inputs,

Oh sorry, My typo caused you to not understand my last paragraph.

Yea the rings are scaled in dB, but the plot does not show at WHICH places we have those 6dB reduction and so on, What's the reason of that? If we do not have any info about the locations where the output decrases by every 6dB then showing those dB's in the plot seems to be useless, unless every 6dB is for doubling the distance and so?!

the second point which makes me confused is that I think the ultrasonic sensor should be placed at the center of the plot, so it has the max of power at the center and the minimum at the outer ring, but What I see in the plot is completely in oppose to what I think, i.e the outer ring has 0dB and the iner ring has -30dB???!! So does the imaginary sensor is placed at the outer ring??

SO I have to say that I am not able to honestly interpret a polar plot for a sensor, the only thing I can tell when looking at a such plot is the angle of the main lob (even I do not know which parameters should be known for the angle though!).

I made a lot of searches via the net and opend several of the pages but they did not have any tutorial in the field!
 
Last edited:
Look at my attachment.

Consider the transducer being driven by a 40khz signal.
We use a microphone to listen to the 40khz signal and find that the maximum output from the transducer is from the front face.
We adjust our measuring equipment to read 0dB.
We then move the microphone 30deg to the right, keeping it the same distance from the transducer and we see that the signal now measures 9dB less on our measuring equipment.
Moving the microphone 90deg to the right, we see that the signal now measures 27dB less on our measuring equipment.

Does that description help your understanding?

JimB
 

Attachments

  • Transducer polar plot.PNG
    Transducer polar plot.PNG
    54.6 KB · Views: 114
Yea the rings are scaled in dB, but the plot does not show at WHICH places we have those 6dB reduction and so on, What's the reason of that? If we do not have any info about the locations where the output decrases by every 6dB then showing those dB's in the plot seems to be useless, unless every 6dB is for doubling the distance and so?!

the second point which makes me confused is that I think the ultrasonic sensor should be placed at the center of the plot, so it has the max of power at the center and the minimum at the outer ring, but What I see in the plot is completely in oppose to what I think, i.e the outer ring has 0dB and the iner ring has -30dB???!! So does the imaginary sensor is placed at the outer ring??
I now understand your confusion.

The plot does not show output versus distance. Forget distance. It shows the relative output versus off-axis direction at a constant distance (whatever distance is used for the measurement). The maximum output is arbitrarily stated to be 0dB at the measured distance and the off-axis output is less than that, thus the negative dBs.

The oval line is the plot that shows the fall-off in output versus off-axis angle.
 
Status
Not open for further replies.

New Articles From Microcontroller Tips

Back
Top