Continue to Site

Welcome to our site!

Electro Tech is an online community (with over 170,000 members) who enjoy talking about and building electronic circuits, projects and gadgets. To participate you need to register. Registration is free. Click here to register now.

  • Welcome to our site! Electro Tech is an online community (with over 170,000 members) who enjoy talking about and building electronic circuits, projects and gadgets. To participate you need to register. Registration is free. Click here to register now.

How To Read This

Status
Not open for further replies.

codan

New Member
Hi All,

I have just pulled most of my hair out & setup an old PC Data Acquisition card in an old computer, it has an oscilloscope function etc but with no instructions--secondhand.
I have hooked up a circuit to read the frequency of the pulses to test things out, after much playing around i have what seems to be a good reading on the Monitor?
Is this ok for a reading of the frequency of a circuit?

Now i need to learn how to read this, can somebody please help me out.

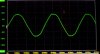
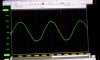
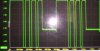
I have attached a picture i have taken of the reading, it is a little out of focus.

Far Left verticle column of numbers is Voltage.

The time readings are a bit hard to read on the bottom but from left to right read:

0s 163.80us 327.60us 491.40us 655.20us 819.00us 982.80us 1.15ms 1.31ms 1.47ms 1.64ms.

I am not sure how to work out the frequency of this circuit or how many us or ms in a second etc--AARRGGGHHH!!
Not sure even if i have the settings right to do this?

The pulses vary so what do you call this type of Signal?

Also on the reading on the Horizontal lines --just below centre--some are a little fuzzy, is this just some sort of electrical interference?

Thank You
 

Attachments

  • FR 002.jpg
    FR 002.jpg
    227.3 KB · Views: 205
Ok, i'll give it a shot:

It takes 819.00us to complete one cycle, that is .000819sec

So if i get 1 divided by .000819= 1221 Hz

Is this correct? Or do i have no idea?
 
codan said:
I have hooked up a circuit to read the frequency of the pulses to test things out, after much playing around i have what seems to be a good reading on the Monitor?
Looks like a reasonable waveform, but not knowing what the signal should look like I cant really comment.

codan said:
Is this ok for a reading of the frequency of a circuit?
Not really, see my comments further down the page.

codan said:
The time readings are a bit hard to read on the bottom but from left to right read:

0s 163.80us 327.60us 491.40us 655.20us 819.00us 982.80us 1.15ms 1.31ms 1.47ms 1.64ms.

I am not sure how to work out the frequency of this circuit or how many us or ms in a second etc--AARRGGGHHH!!
There are 1,000,000 uS in one second and 1,000mS in one second.
Just the same as there are 1,000,000 micro anything, or 1,000 milli anything in a whole one.:)
It is difficult to assign a frequency to such a signal as it will have components at many frequencies.
If the waveform were a regular pattern, you could measure the period of one cycle of that pattern, then you can calculate the frequency by taking the reciprocal of the period.

eg if the period of the waveform is 20mS (0.02seconds), then the frequency is 50hz, (1/0.02).

codan said:
The pulses vary so what do you call this type of Signal?
At a quick look, there seems to be narrow pulses and wide pulses, again not knowing the source of the signal, it is difficult to say, but it looks like a form of Pulse Width Modulated signal.

codan said:
Also on the reading on the Horizontal lines --just below centre--some are a little fuzzy, is this just some sort of electrical interference?
Not necessarily interference, as in an unwanted external signal. It could be that the voltage is varying a little bit, or there is some noise on the signal.
A digital oscilloscope can only display the voltage in a discrete number of steps, so as the signal goes above or below one of the step values, so the trace will jump up and down as you see on your trace.

JimB
 
codan said:
Ok, i'll give it a shot:

It takes 819.00us to complete one cycle, that is .000819sec

So if i get 1 divided by .000819= 1221 Hz

Is this correct? Or do i have no idea?

That's right, and it is quite simple if you stop thinking that it is complicated.

Frequency is cycles per second. That's cycles/second. That's number of cycles divided by time in seconds, and that is exactly what you did, 1 cycle divided by .000819 second.:D

However, you have more than 1 frequency producing the attached display.
 
Last edited:
That's more or less a square wave. At least it's closer to a square wave than it is to a sine or triangle wave. :) Without knowing what circuit you hooked up it's really quite impossible to tell you whether that's a reasonable reading for what the circuit is supposed to be doing, but it looks like you're definitely getting some kind of reading from it. That's a start.

There are a thousand ms (milliseconds) in a second. There are a billion ns (nanoseconds) in a second. There's a list of them and more information on the Wikipedia page on SI scale prefixes: https://en.wikipedia.org/wiki/SI_prefix

The signal looks more like logic than anything else (to me; maybe someone with more experience can recognize what it actually might be). I wouldn't worry too much about its frequency, but in general to get the frequency you measure from, say, one peak of a sine wave to the next peak, and how many time that will fit into one second is the frequency. Say you have a sine wave. Measure from one peak to the next. Say you find that there is 2ms from the first peak to the second. 2ms is 2 milliseconds, or 2 thousandths of a second, so that happens 500 times in one second, so the frequency is 500Hz. For a square wave you can measure from one rising edge to the next rising edge.


Hope this helps,

Torben
 
codan said:
Ok, i'll give it a shot:

It takes 819.00us to complete one cycle, that is .000819sec

So if i get 1 divided by .000819= 1221 Hz

Is this correct? Or do i have no idea?

Correct!
But with reservations.
The waveform does appear to repeat, so you could say that the "repetition frequency" is 1221hz, but be aware that this is a complex waveform, so there are many frequencies within the waveform.

JimB
 
hi,
You did not say what the source of the input signal is.??

The period of 'A' is about 200uSec
The period of 'B' is about 100uSec
The period of 'C' is three bursts of 'B'

'E' is the sequence repeating..
 
Last edited:
Thanks to all who replied, i get what your saying about the complex nature of the signal the the Frequencies with the Frequency so to speak. All very interesting!

One thing though, i thought it was a square wave, can i have this set incorrectly showing some other waveform as a square wave?

I have run it on the transient function & every setting imaginable & all i get is a square waveform?

The signal is coming from an old Metal Detector of mine.
 
codan said:
Thanks to all who replied, i get what your saying about the complex nature of the signal the the Frequencies with the Frequency so to speak. All very interesting!

One thing though, i thought it was a square wave, can i have this set incorrectly showing some other waveform as a square wave?

I have run it on the transient function & every setting imaginable & all i get is a square waveform?

The signal is coming from an old Metal Detector of mine.

If that's because I said it looks kind of like a square wave, that's just because the waveform is square-ish. It's certainly not a sine or triangle or sawtooth, for instance. I think the definition of a true square wave is that it is regular--i.e. it goes instantly from low to high, stays there for some length of time, then drops instantly from high to low, stays there for the same length of time, and repeats. I wouldn't call this a true square wave, but I could be wrong about that.


Torben
 
Torben said:
If that's because I said it looks kind of like a square wave, that's just because the waveform is square-ish. It's certainly not a sine or triangle or sawtooth, for instance. I think the definition of a true square wave is that it is regular--i.e. it goes instantly from low to high, stays there for some length of time, then drops instantly from high to low, stays there for the same length of time, and repeats. I wouldn't call this a true square wave, but I could be wrong about that.


Torben

hi Torben,
That would also be my interpretation of the waveform.

I would suggest the OP inputs a variable amplitude sine wave from a generator in order to check it out.
 
codan said:
Please advise?

hi,
Do you have access to any electronic equipment that is able to generate a sinewave signal.?
 
I can setup something simmilar if i have this correct.

I have a stepdown 240v AC to 12V AC transformer that i can connect to the mains via a 10amp Variac that should produce a low voltage sine wave--if i have this correct.

Do you mean input a sine wave into the O-scope to check it is functioning correctly?

Thank for your input on things, it is very helpful.
 
codan said:
I can setup something simmilar if i have this correct.

I have a stepdown 240v AC to 12V AC transformer that i can connect to the mains via a 10amp Variac that should produce a low voltage sine wave--if i have this correct.

Do you mean input a sine wave into the O-scope to check it is functioning correctly?

Thank for your input on things, it is very helpful.
hi,

Using a Variac with a step down isolated transformer would be a simple check.

Use a voltmeter to check the rms value of the sinewave, allow a peak sine amplitude of Vrms * 1.4 eg: if your voltmeter reads 1Vac then the sinewave on the PC should appear as a 2.8V peak to peak waveform. OK.

Not knowing your location I dont know the local mains frequency 50 or 60Hz,this would give the X timebase a rough calibration check.

Turn the Variac output to zero before you connect the output of the isolated mains transformer to the input of the PC card.

Adjust the Variac VERY slowly.

Do you follow.?
 
Hi,

Australia--50Hz, yep i follow, see image attached!

I'll set it up & post results when finished, thank you once again.

You'll be saying, bloody Aussie
 
Might be better if i attach the image to give an idea, i'll get started.
 

Attachments

  • I Follow.gif
    I Follow.gif
    15.9 KB · Views: 166
codan said:
Might be better if i attach the image to give an idea, i'll get started.
hi,
Is that a before or after photo.?:eek:

I'm pleased to say all the Ozzies I interact with on this forum are 'fair dinkum'
including the honorary Ozzies.!:p
 
ericgibbs said:
hi,

Using a Variac with a step down isolated transformer would be a simple check.

Use a voltmeter to check the rms value of the sinewave, allow a peak sine amplitude of Vrms * 1.4 eg: if your voltmeter reads 1Vac then the sinewave on the PC should appear as a 2.8V peak to peak waveform. OK.
Do you follow.?

Hi,

That was the before picture, you don't want to see the after shot!

I set it up & fumbled around on the O-scope & have attached the results.
It's a bit out of focus again, left hand verticle column is in 5.0V increments & time left to right is in 5ms steps.

I set the input voltage at 6.0v with the multimeter so do i multiply this by 1.4 to get peak values, the scope is at 8.4v?
Thought there may have been a typing error on the previous post?

For the time settings i went 1 divided by 50Hz= .02/sec = 20ms if i have it right, it seems to be ok on the O-scope.
 

Attachments

  • 50Hz.jpg
    50Hz.jpg
    128 KB · Views: 179
codan said:
Hi,

That was the before picture, you don't want to see the after shot!

I set it up & fumbled around on the O-scope & have attached the results.
It's a bit out of focus again, left hand verticle column is in 5.0V increments & time left to right is in 5ms steps.

I set the input voltage at 6.0v with the multimeter so do i multiply this by 1.4 to get peak values, the scope is at 8.4v?
Thought there may have been a typing error on the previous post?

For the time settings i went 1 divided by 50Hz= .02/sec = 20ms if i have it right, it seems to be ok on the O-scope.

hi,
The Xaxis looks OK, 1/50 =.02 sec...

I cant read the Y axis scale.

Usually a DVM reads the rms value of a sinusiod, that is Vpeak * 0.707

So the 6Vrms of the meter should translate to 6 *1.4 =8.4Vpk or 16.8V pk to pk.

When you take your photo's, do you have a 'macro' focus on the camera.?
If not move further away from the PC screen.

Google for: Screen Hunter freeware its a program that enables you to take a screen shot of the PC screen or just a rectangular area.
The shot can be saved as a bmp or jpg [jpg is a smaller file]

Its possible to get good images from the screen using ScreenHunter.
You can then edit them using a photo edit program.

Give it a try and repost the image....:)
 
Hi,

Try this one, i wasn't that close before just cropping the pictures to make uploading them quicker--no broadband where i am unfortunately. I have tried at a different angle & not cutting the picture down so much--hope it works.
 

Attachments

  • FR.jpg
    FR.jpg
    137 KB · Views: 174
Status
Not open for further replies.

Latest threads

Back
Top