Continue to Site

Welcome to our site!

Electro Tech is an online community (with over 170,000 members) who enjoy talking about and building electronic circuits, projects and gadgets. To participate you need to register. Registration is free. Click here to register now.

  • Welcome to our site! Electro Tech is an online community (with over 170,000 members) who enjoy talking about and building electronic circuits, projects and gadgets. To participate you need to register. Registration is free. Click here to register now.

FFT in LTSpice

Status
Not open for further replies.

atferrari

Well-Known Member
Most Helpful Member
I am confused about this: what it is the actual reference (0 dB) as shown in the graphic of a FFT from a certain signal?

In other words, the level of the harmonic content is it compared to what?
 
Last edited:
Hi atferrari,

0 dB is referenced to 1 Volt RMS. Do an FFT on a sinewave V source set to; 1.41414 Volts to verify for yourself.

Regards,
Ifixit
 
Last edited:
In other words, the level of the harmonic content is it compared to what?

Hi Atferrari,

Actually, there are two ways to get that type of data from an analysis. One is the FFT plot and the other is from a spice directive that can be view in the spice error log.

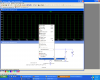
Regarding the FFT, 2V P-P in is 0db. But let's say you have a 50Ω input Z and a 50Ω source impedence rather than 0Ω source Z, the input level will be -3db, for obvious reasons. You know how to pull up the FFT plot, obviously, but the other way to look at the harmonic content is by selecting the Spice Error Log rather than FFT from the same menu selection point AFTER you place the necessary Spice Directive on the schematic.

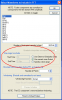
To do that, click on the .op button on the tool bar and type in the directive with the following basic format:

.four <fundamental frequency> <number of harmonics> <label to be evaluated>

The number of harmonics can be omitted and default number of 9 harmonics will be evaluated and presented along with the total harmonic distortion. If you have multiple points to be evaluated, such as a cascaded amplifier, just add their labels to the list; a handy tool to tweek I/O loading and Z.

Here is an example directive for a 3 stage amp sampling the output each stage with a 10 MHz input, 5 harmonics to be evaluated for total harmonic distortion and sampling the outputs of each stage. In this case, it points right to the stage(s) with a problem if any.

.four 10e6 5 Out1 Out2 Out3 or .four <10MHz> <evaluate the first 5 hamonics> <evaluate 1st output> <evaluate 2nd output> <evaluate 3rd output>

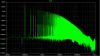
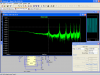
I'll include an FFT and a spice error log of a 10MHZ passive tripler I designed with both the FFT and spice error log with the fourier evaluation.

Hope this is clear and will help.
 

Attachments

  • 10MHz Tripler FFT.jpg
    10MHz Tripler FFT.jpg
    272.9 KB · Views: 629
  • 10 MHz Tripler Err Log.jpg
    10 MHz Tripler Err Log.jpg
    224.1 KB · Views: 476
.four directive working - just a detail

Thanks to you all for your time.

Cecil, got it. Thanks for that.

Something I noticed is this:

In my circuit, the clock's frequency is 1KHz and Vout, the output signal is (because of the process) one 12th of it.

I want to have the FFT of Vout.

No matter how I mention the value of the 1st harmonic in the ".four" statement, like this (1K/12) or (1000/12) or 1000/12 or 1K/12, I get a message of error or LTSpice recognizing just the first value, that is, 1KHz.

The solution seems to calculate 1K/12 myself, stating .four 83.3333 7 V(vout)

Is any way to avoid that calculation leaving it to LTSpice? One day I could make it wrong...
 
Is any way to avoid that calculation leaving it to LTSpice? One day I could make it wrong...

To do that, the frequency needs to be expressed as follows to do the math without an error:

.four {1e3/12} ...etc. The "squiggle" bracket appears to let the program know there is a calculation to be performed. These brackets make it throw-up, () and [].
 
Gracias for that, Cecil.
 
Agustin, if you plot a waveform by probing it, then right-click on the waveform window, a menu will open. At the very bottom is "view". If you hover over that, "FFT" is one of the options. When you click on "FFT", you will get an FFT waveform selection menu. Pay special attention to the "Time range to include" option. If you have a startup transient, you might want to zoom on a portion of the waveform that is stable before selecting the FFT option.

If you already know all this and are trying to do something else... Never mind!:p
 

Attachments

  • waveform menu.PNG
    waveform menu.PNG
    100.8 KB · Views: 360
  • FFT waveform select.PNG
    FFT waveform select.PNG
    24.8 KB · Views: 391
  • FFT example.PNG
    FFT example.PNG
    32 KB · Views: 428
Last edited:
Gracias Ron.

Sure I do not know all. Testing many things now. For the moment, all stable waveforms.

Honestly I should know more about DFT.
 
Took a few minutes to figure out, but I did, after you get the plot, left click the identifier at the top and then move the cursor to the spike and it tells you the Frequency.
Thanks again
Kinarfi
 

Attachments

  • untitled.PNG
    untitled.PNG
    69.5 KB · Views: 314
Took a few minutes to figure out, but I did, after you get the plot, left click the identifier at the top and then move the cursor to the spike and it tells you the Frequency.
Thanks again
Kinarfi
It also shows harmonics and their amplitudes. You probably know that you can zoom to get better resolution.
 
Status
Not open for further replies.

Latest threads

New Articles From Microcontroller Tips

Back
Top