Continue to Site

Welcome to our site!

Electro Tech is an online community (with over 170,000 members) who enjoy talking about and building electronic circuits, projects and gadgets. To participate you need to register. Registration is free. Click here to register now.

  • Welcome to our site! Electro Tech is an online community (with over 170,000 members) who enjoy talking about and building electronic circuits, projects and gadgets. To participate you need to register. Registration is free. Click here to register now.

How to calculate the value of a smoothing capacitor

Status
Not open for further replies.
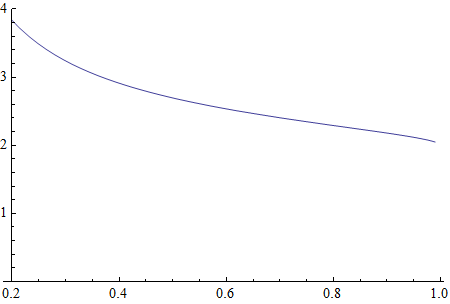
I don't see any plots. Here's what I get for the ratio C(FullWave)/C(HalfWave) for K ranging from 0.2 to 0.95:
filt9-png.93182


Hello Electrician,

That's because there arent any plots there :)
Getting late over here :)

Ok, here's the plot, but the plot of the wRC constant might be more interesting. Since w, R, and C all enter the formula as a factor w*R*C we can plot that which allows us to calculate the value of C based on any line frequency or load resistance. From this plot all we need to do is divide by w and divide by R to get the right cap value. But let's see if i can remember to post the plots with it this time :)

I'm posting the wRC plot first, and in the ratio plot ignore the red plot. Our ratio plots match up.
 

Attachments

  • wRC_vs_K-01.gif
    wRC_vs_K-01.gif
    7.3 KB · Views: 183
  • Ratio_FullOverHalfWave.gif
    Ratio_FullOverHalfWave.gif
    6.7 KB · Views: 164
My assumptions are not false. They might not be comprehensive, but they are not false. If necessary, I could include other factors into the plot.

Ratch
The assumptions in your presentation assume an ideal voltage sourcing bridge with 0R and ideal Caps
 
The assumptions in your presentation assume an ideal voltage sourcing bridge with 0R and ideal Caps

Just like most exercises assume ideal L's and C's. But the plots and calculations are correct based on those assumptions.

Ratch
 
I dropped Vf and ESR on Diodes to near 0 but left capacitance so negative current spikes. ( high due to low ESR of 1 uΩ which is about right.)

I displayed V, I, Watts for both parts, where cap is VAR

Note: peak Cap current is due to duty cycle and ripple =/-4% Vp and cap 2.4 A-p and 218 VAR peak

Since Diode surge current is same as Cap, these are critical parameters in choosing rectifier parts for peak currents or ripple current.
upload_2015-7-5_17-0-31.png


Compute your results for Max and min levels and report back using 50Hz 1K 100uF

Note linear relationship between peak VAR of Cap and Pmin to load is 26:1 and Vripple is inverse of that or +\- 4%

Adding realistic ESR to diodes and cap adds a somewhat amplified sine tip to charge ramp voltage which resembles a fast rising triangular wave, (peak sine-following V to max then slow droop decay, so reality says with non-linear devices and no R or L filter, theory cannot be realized in tests.
 
Last edited:
I dropped Vf and ESR on Diodes to near 0 but left capacitance so negative current spikes. ( high due to low ESR of 1 uΩ which is about right.)

I displayed V, I, Watts for both parts, where cap is VAR

Note: peak Cap current is due to duty cycle and ripple =/-4% Vp and cap 2.4 A-p and 218 VAR peak

Since Diode surge current is same as Cap, these are critical parameters in choosing rectifier parts for peak currents or ripple current.
View attachment 93204

Compute your results for Max and min levels and report back using 50Hz 1K 100uF

Note linear relationship between peak VAR of Cap and Pmin to load is 26:1 and Vripple is inverse of that or +\- 4%

Adding realistic ESR to diodes and cap adds a somewhat amplified sine tip to charge ramp voltage which resembles a fast rising triangular wave, (peak sine-following V to max then slow droop decay, so reality says with non-linear devices and no R or L filter, theory cannot be realized in tests.

OK, the plot is below. The diodes take 1.4 volts from the 100 volt P-P power supply. The voltage drops to 90 volts before the power supply restores the voltage to 98.5 volts after 87 msec.
Tony Stewart1.JPG


The orange line is the 100 volt full-wave. The blue line is the wave after going through 2 diodes. The green line is the capacitor de-energize line. The red line is a 90 volt line.

The current of the capacitor is shown below. The current drops from about 100 ma to 90 in 87 msec, then goes to zero when the power supply energizes it again.

Ratch

Tony Stewart2.JPG
 
My plots read
for R I = 100 mA max 91.7 min .. subtract 2 diode drops agrees with your 90 mA or ~ 10% drop with RC=10T ( inverse relationship agrees with my initial assumption. This should be close for 3T and more accurate for 50T but then Cap surge current is excessive
For C I = 2.37A peak during charge.. discharge will match V/R ( peak power ratios VAR/Pload seem more accurate than Ich/Idischarge linear inverse with Vdroop%
 
Adjust the diodes to 0.7V @ 1A or an ESR of 0.12 Ω approx.
Thus I cap= 1.24A max and min -98mA
I get this
upload_2015-7-5_18-53-22.png


Zooming into Cap current on startup for above.
We see Ic is 32x the load current of 0.1A and that's best case from 0 deg.


Attachments

  • upload_2015-7-5_19-3-5.png
    upload_2015-7-5_19-3-5.png
    3.1 KB · Views: 170
Last edited:
**broken link removed**
 
Adjust the diodes to 0.7V @ 1A or an ESR of 0.12 Ω approx.
Thus I cap= 1.24A max and min -98mA
I get this
View attachment 93210

Zooming into Cap current on startup for above.
We see Ic is 32x the load current of 0.1A and that's best case from 0 deg.

First of all, are you computing transients. I am not. Am I supposed to do so?
 
Both charge and discharge currents for steady state and startup added

Only if you want to understand my Rules of THumb for Duty cycle, droop and peak current or power ratios. of charge vs discharge with a linear load.

As far as droop. I think my sim agrees with your calculations. at least close enough for government work...

My calculations indicate that at startup 3.1 amps max will be needed to bring the cap up to full voltage within a half cycle period. But there is nothing saying that the cap has to be fully energized within a half cycle period, is there? As long as more current is put into the RC parallel combination than it loses, the voltage will attain its steady state level.

Ratch
 
I agree adding series R cause less ripple current

If droop is 10% at 100uF 1k 50 Hz FW and 10 Ohms is added in series or 1% of load and power is switched on at peak voltage, the worse case current is a step function with 98.5V/10R = 9.85 Amps peak

imagine the peak current when Power starts at peak voltage with Rs=0 limited now by diode ESRx2 =~1Ω for 1W diodes supplying 10W load.
 
I don't think we are on the same wave length. I was not thinking of adding any resistance in series with the RC parallel combination. Also, turning on the power source supplies a sinusoidal wave voltage starting at some phase, not a step voltage. I would think that the 0.7 volt drop would take into consideration any internal resistance of the diode. And what are a few ohms in comparison with a 1000 ohm load?

Ratch
 
Hello again,

I find that the diode and extra series resistance dont change the ripple percent as much as it changes the output peak and average DC output. They subtract from the input voltage so that's no surprise.

Shown in the attachment is the calculation for a full wave bridge setup with spice diodes and series resistance using a semi analytical approach which is much faster than a simulation. The calculations are embodied in the program and that calculates the percent ripple as well as peak and dip.

This is for full wave, and you can see by the results that the diode and input resistance help to filter a little as we only needed a 65uf cap to get 10 percent ripple. Note however that the peak is much lower than it would be with an ideal diode.
 

Attachments

  • ScreenShot_BridgeRectifierCalculator-1.jpg
    ScreenShot_BridgeRectifierCalculator-1.jpg
    40.2 KB · Views: 197
The Difference of std vs low ESR is negligible in 10W Bridges with designs for low droop <10% and becomes dominant above 100W bridges as voltage rise 2nd order effects take over. (I squared ESR) when droop is only 5% peak current is 20x and peak power loss is 400xESR

so the 65 uF @60Hz or 100uF @50Hz becomes 1mF @50Hz and 2mF at 10% droop and at >100V ratings
general purpose caps of 2.2mF @ 100 workingV are typically 130 mOhm and rated for 2.6 Aac ripple but meanwhile peak repetitive current with 10% droop is now at least 20x the 1Adc 100V 100W or 20 A peak and voltage rise is now 20*20* 0.13= 52V spike or 50% of Vdc.

Thats when very low ESR is critical and droop is compromised then to 30% with added series R to reduce ripple.
So it is narrow scope to only analyze a 10W example. Even low voltage high power car battery supplies need massive caps at ultralow ESR values.

Thus the big picture is the power square law effects on ESR affects both peak lossy voltage rise or ripple voltage, ripple current and % power loss.

Its like analyzing a bird and trying to linear scale to mammoth scales . It will never fly from 2nd order effects. In the old days, we used computer grade caps for 100W power supplies bigger than a beer in 0.1F range for low ripple and droop.
 
Last edited:
Hi there Tony,

Yes good point. I was just recreating the example we had been doing for a while in this thread, namely the one with the 1000 ohm load resistor, so that's not even 10 watts :)

I could easily add cap ESR to the program and see what it spits out. We can see how well your calculations came out then too.

But first, are you saying that since the cap ESR itself will be responsible for some of the ripple voltage with greater loads that the cap value will have to be raised to make up for that loss?
I believe that is true to some extent, but in higher power converters we never use one single capacitor, we use several in parallel with heavy buss bars to connect them. This means that roughly the ESR of one cap gets divided by the number of caps:
ESR_Total=ESR_EachOne/NumberOfCapsInParallel

while the capacitance goes up:
C_Total=C_EachOne*NumberOfCapsInParallel

But your point is still valid of course, and i will add the cap ESR to the program and see what happens.

[LATER]
The ESR made about 5 to 6 percent difference already.
The left screen shot is with 0.00 ohms ESR while the right has 0.13 ohms.
 

Attachments

  • ScreenShot_BridgeRectifierCalculator-2.jpg
    ScreenShot_BridgeRectifierCalculator-2.jpg
    78.1 KB · Views: 180
Last edited:
Next try 100W as I did at 50Hz then 1kW @100V and feel free to scale C up x10 and ESR /10 after 100W to see the quadratric effects of ESR and why gen.purp. caps must be replaced with lower ESR types.
 
Hello again,

Ok, using the result from the ideal case, we have the relationship:
w*R*C=K

where K is a constant, which depends on the first values of R and C we chose for a given ripple, even if that was chosen based on a measurement rather than calculation assuming the ideal case.

This tells us that if we lower R by 10 times then we need to increase C by 10 times. You already did this, but i just wanted to point out that result did show up in the ideal case, so we could have learned that from the ideal case too.

When i start with 100v, 100 ohm load, and 2000uf cap with ESR=0, i dont see too much change in the ripple percent when the ESR goes up to 0.15 ohms. It comes out to a fraction of a percent increase.
Now when i increase load current 10 times with ESR=0.15 i see the percent ripple go up by 600 percent, so i increase the cap value to 20000uf, and see the ripple come down so that it is now increased from the first case by only 100 percent. So with the load increased 10 times and the cap increased 10 times without changing the ESR, i see the ripple increase by 100 percent.

However, if we had an original load of 1 amp we would have selected a cap that could handle the ripple current and with ESR=0.150 just because it came that way vs the cost of the component. So when we increase the load by 10 times we might consider using 10 of these caps in parallel. This would lead to an equivalent ESR of roughly 0.015 because each cap only has to handle one-tenth of the ripple current. The result with this ESR brings us back close to the original ripple voltage.

So the conclusion seems to be that increasing the value of the capacitance alone will still allow the ripple to increase although not as much as without increasing it, but using a number of capacitors in parallel helps to keep the ripple percentage down to a much lower number similar what we saw with I/N and C/N and the ESR of one cap.
 
I wonder if that could that be K= R*C*2f where K =1/%droop similar to what I started with

OK on the rest.

Of course a soft start would be prudent as 100V peak startup into 15 mOhms ESR Cap ( and ~same for diodes could be 50 mOhms total or 100/0.05 or 2000 Amp surge on startup, worst case.. I recall my Panasonic 100W/ch amp had a relay to bypass the soft start resistor after 3 seconds.
 
The Difference of std vs low ESR is negligible in 10W Bridges with designs for low droop <10% and becomes dominant above 100W bridges as voltage rise 2nd order effects take over. (I squared ESR) when droop is only 5% peak current is 20x and peak power loss is 400xESR

so the 65 uF @60Hz or 100uF @50Hz becomes 1mF @50Hz and 2mF at 10% droop and at >100V ratings
general purpose caps of 2.2mF @ 100 workingV are typically 130 mOhm and rated for 2.6 Aac ripple but meanwhile peak repetitive current with 10% droop is now at least 20x the 1Adc 100V 100W or 20 A peak and voltage rise is now 20*20* 0.13= 52V spike or 50% of Vdc.

How does a current*current*resistance = voltage?
 
Status
Not open for further replies.

New Articles From Microcontroller Tips

Back
Top